
Page 138 - Read Online
P. 138
Page 10 of 13 Xu et al. Microstructures 2023;3:2023034 https://dx.doi.org/10.20517/microstructures.2023.19
Figure 9. Impedance diagram of NN-SMZ ceramics. (A) x = 0.05, (B) x = 0.08, (C) x = 0.12, and (D) x = 0.15. (E) Impedance diagram of
NN-SMZ components at 560 °C, (F) Band gap energy for NN-SMZ ceramics, (G) The fitted activation energy of NN-SMZ.
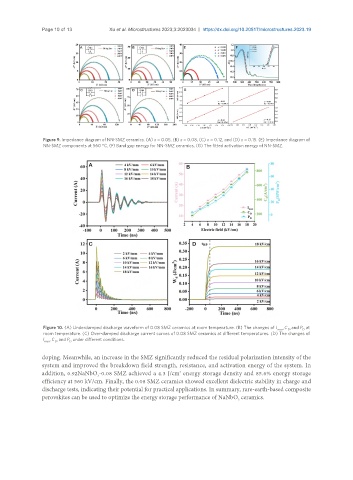
Figure 10. (A) Underdamped discharge waveform of 0.08 SMZ ceramics at room temperature. (B) The changes of I max , C , and P at
D
D
room temperature. (C) Over-damped discharge current curves of 0.08 SMZ ceramics at different temperatures. (D) The changes of
I max , C , and P under different conditions.
D
D
doping. Meanwhile, an increase in the SMZ significantly reduced the residual polarization intensity of the
system and improved the breakdown field strength, resistance, and activation energy of the system. In
addition, 0.92NaNbO -0.08 SMZ achieved a 4.3 J/cm energy storage density and 85.6% energy storage
3
3
efficiency at 560 kV/cm. Finally, the 0.08 SMZ ceramics showed excellent dielectric stability in charge and
discharge tests, indicating their potential for practical applications. In summary, rare-earth-based composite
perovskites can be used to optimize the energy storage performance of NaNbO ceramics.
3