
Page 135 - Read Online
P. 135
Xu et al. Microstructures 2023;3:2023034 https://dx.doi.org/10.20517/microstructures.2023.19 Page 7 of 13
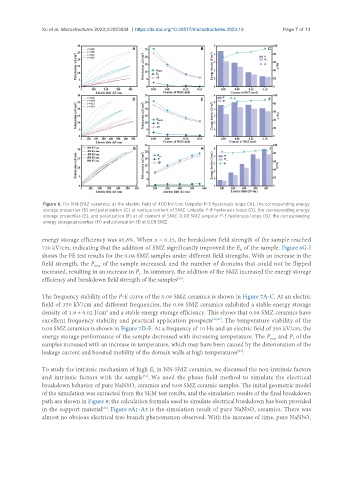
Figure 6. For NN-SMZ ceramics: at the electric field of 400 kV/cm: Unipolar P-E hysteresis loops (A), the corresponding energy
storage properties (B) and polarization (C) at various content of SMZ. Unipolar P-E hysteresis loops (D), the corresponding energy
storage properties (E), and polarization (F) at all content of SMZ. 0.08 SMZ unipolar P-E hysteresis loops (G), the corresponding
energy storage properties (H) and polarization (I) at 0.08 SMZ.
energy storage efficiency was 85.6%. When x = 0.15, the breakdown field strength of the sample reached
720 kV/cm, indicating that the addition of SMZ significantly improved the E of the sample. Figure 6G-I
b
shows the FE test results for the 0.08 SMZ samples under different field strengths. With an increase in the
field strength, the P of the sample increased, and the number of domains that could not be flipped
max
increased, resulting in an increase in P . In summary, the addition of the SMZ increased the energy storage
r
efficiency and breakdown field strength of the samples .
[29]
The frequency stability of the P-E curve of the 0.08 SMZ ceramics is shown in Figure 7A-C. At an electric
field of 350 kV/cm and different frequencies, the 0.08 SMZ ceramics exhibited a stable energy storage
density of 1.9 ± 0.02 J/cm and a stable energy storage efficiency. This shows that 0.08 SMZ ceramics have
3
excellent frequency stability and practical application prospects [30,31] . The temperature stability of the
0.08 SMZ ceramics is shown in Figure 7D-F. At a frequency of 10 Hz and an electric field of 350 kV/cm, the
energy storage performance of the sample decreased with increasing temperature. The P and P of the
r
max
samples increased with an increase in temperature, which may have been caused by the deterioration of the
[23]
leakage current and boosted mobility of the domain walls at high temperatures .
To study the intrinsic mechanism of high E in NN-SMZ ceramics, we discussed the non-intrinsic factors
b
and intrinsic factors with the sample . We used the phase field method to simulate the electrical
[31]
breakdown behavior of pure NaNbO ceramics and 0.08 SMZ ceramic samples. The initial geometric model
3
of the simulation was extracted from the SEM test results, and the simulation results of the final breakdown
path are shown in Figure 8; the calculation formula used to simulate electrical breakdown has been provided
in the support material . Figure 8A1-A3 is the simulation result of pure NaNbO ceramics. There was
[32]
3
almost no obvious electrical tree branch phenomenon observed. With the increase of time, pure NaNbO
3