
Page 134 - Read Online
P. 134
Page 6 of 13 Xu et al. Microstructures 2023;3:2023034 https://dx.doi.org/10.20517/microstructures.2023.19
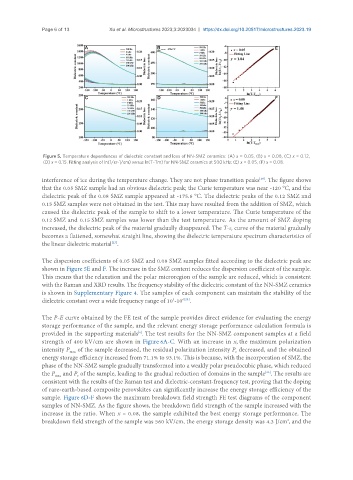
Figure 5. Temperature dependences of dielectric constant and loss of NN-SMZ ceramics: (A) x = 0.05, (B) x = 0.08, (C) x = 0.12,
(D) x = 0.15. Fitting analysis of ln(1/εr-1/εm) versus ln(T-Tm) for NN-SMZ ceramics at 500 kHz: (E) x = 0.05, (F) x = 0.08.
interference of ice during the temperature change. They are not phase transition peaks . The figure shows
[26]
that the 0.05 SMZ sample had an obvious dielectric peak; the Curie temperature was near -120 °C, and the
dielectric peak of the 0.08 SMZ sample appeared at -175.6 °C. The dielectric peaks of the 0.12 SMZ and
0.15 SMZ samples were not obtained in the test. This may have resulted from the addition of SMZ, which
caused the dielectric peak of the sample to shift to a lower temperature. The Curie temperature of the
0.12 SMZ and 0.15 SMZ samples was lower than the test temperature. As the amount of SMZ doping
increased, the dielectric peak of the material gradually disappeared. The T-ε curve of the material gradually
r
becomes a flattened, somewhat straight line, showing the dielectric temperature spectrum characteristics of
the linear dielectric material .
[27]
The dispersion coefficients of 0.05 SMZ and 0.08 SMZ samples fitted according to the dielectric peak are
shown in Figure 5E and F. The increase in the SMZ content reduces the dispersion coefficient of the sample.
This means that the relaxation and the polar microregion of the sample are reduced, which is consistent
with the Raman and XRD results. The frequency stability of the dielectric constant of the NN-SMZ ceramics
is shown in Supplementary Figure 4. The samples of each component can maintain the stability of the
3
6[28]
dielectric constant over a wide frequency range of 10 -10 .
The P-E curve obtained by the FE test of the sample provides direct evidence for evaluating the energy
storage performance of the sample, and the relevant energy storage performance calculation formula is
[6]
provided in the supporting materials . The test results for the NN-SMZ component samples at a field
strength of 400 kV/cm are shown in Figure 6A-C. With an increase in x, the maximum polarization
intensity P of the sample decreased, the residual polarization intensity P decreased, and the obtained
r
max
energy storage efficiency increased from 71.1% to 93.1%. This is because, with the incorporation of SMZ, the
phase of the NN-SMZ sample gradually transformed into a weakly polar pseudocubic phase, which reduced
[23]
the P and P of the sample, leading to the gradual reduction of domains in the sample . The results are
max
r
consistent with the results of the Raman test and dielectric-constant-frequency test, proving that the doping
of rare-earth-based composite perovskites can significantly increase the energy storage efficiency of the
sample. Figure 6D-F shows the maximum breakdown field strength FE test diagrams of the component
samples of NN-SMZ. As the figure shows, the breakdown field strength of the sample increased with the
increase in the ratio. When x = 0.08, the sample exhibited the best energy storage performance. The
3
breakdown field strength of the sample was 560 kV/cm, the energy storage density was 4.3 J/cm , and the