
Page 33 - Read Online
P. 33
Page 8 of 11 Zhao et al. Microstructures 2023;3:2023002 https://dx.doi.org/10.20517/microstructures.2022.21
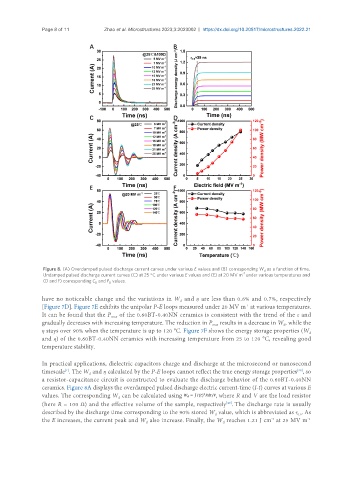
Figure 8. (A) Overdamped pulsed discharge current curves under various E values and (B) corresponding W as a function of time.
d
-1
Undamped pulsed discharge current curves (C) at 25 °C under various E values and (E) at 20 MV m under various temperatures and
(D and F) corresponding C and P values.
D D
have no noticeable change and the variations in W and η are less than 0.6% and 0.7%, respectively
d
[Figure 7D]. Figure 7E exhibits the unipolar P-E loops measured under 20 MV m at various temperatures.
-1
It can be found that the P of the 0.60BT-0.40NN ceramics is consistent with the trend of the ε and
max
gradually decreases with increasing temperature. The reduction in P results in a decrease in W , while the
d
max
η stays over 90% when the temperature is up to 120 °C. Figure 7F shows the energy storage properties (W
d
and η) of the 0.60BT-0.40NN ceramics with increasing temperature from 25 to 120 °C, revealing good
temperature stability.
In practical applications, dielectric capacitors charge and discharge at the microsecond or nanosecond
timescale . The W and η calculated by the P-E loops cannot reflect the true energy storage properties , so
[39]
[1]
d
a resistor-capacitance circuit is constructed to evaluate the discharge behavior of the 0.60BT-0.40NN
ceramics. Figure 8A displays the overdamped pulsed discharge electric current-time (I-t) curves at various E
values. The corresponding W can be calculated using , where R and V are the load resistor
d
(here R = 100 Ω) and the effective volume of the sample, respectively . The discharge rate is usually
[40]
described by the discharge time corresponding to the 90% stored W value, which is abbreviated as τ . As
0.9
d
-3
the E increases, the current peak and W also increase. Finally, the W reaches 1.21 J cm at 25 MV m -1
d
d