
Page 29 - Read Online
P. 29
Page 4 of 11 Zhao et al. Microstructures 2023;3:2023002 https://dx.doi.org/10.20517/microstructures.2022.21
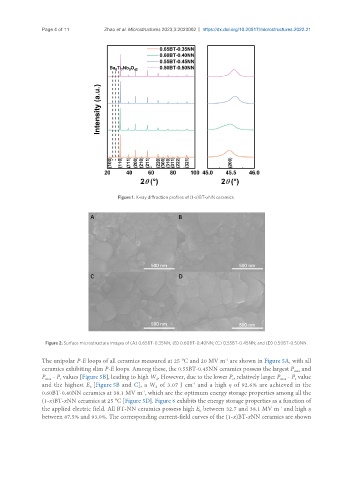
Figure 1. X-ray diffraction profiles of (1-x)BT-xNN ceramics.
Figure 2. Surface microstructure images of (A) 0.65BT-0.35NN; (B) 0.60BT-0.40NN; (C) 0.55BT-0.45NN; and (D) 0.50BT-0.50NN.
-1
The unipolar P-E loops of all ceramics measured at 25 °C and 20 MV m are shown in Figure 5A, with all
ceramics exhibiting slim P-E loops. Among these, the 0.55BT-0.45NN ceramics possess the largest P and
max
P - P values [Figure 5B], leading to high W . However, due to the lower P , relatively larger P - P value
r
d
max
r
max
r
and the highest E [Figure 5B and C], a W of 3.07 J cm and a high η of 92.6% are achieved in the
-3
b
d
0.60BT-0.40NN ceramics at 38.1 MV m , which are the optimum energy storage properties among all the
-1
(1-x)BT-xNN ceramics at 25 °C [Figure 5D]. Figure 6 exhibits the energy storage properties as a function of
the applied electric field. All BT-NN ceramics possess high E between 32.7 and 38.1 MV m and high η
-1
b
between 87.5% and 93.0%. The corresponding current-field curves of the (1-x)BT-xNN ceramics are shown