
Page 132 - Read Online
P. 132
Carr et al. Vessel Plus 2020;4:12 I http://dx.doi.org/10.20517/2574-1209.2020.01 Page 13 of 21
-47% -47% 14% -42% -42% -31% -42% 25% -53% -42% 6% -28% -28% 17% 17% -6% -28% 17% -36% -3% 8% -58% 8% -3% -3% -3% 8% 8% -25% -14% 8% 8% -3% 8% 8% -3% -36%
Δb
Δa -8% -8% 25% -25% -25% -25% -25% 25% -25% -25% 17% 17% -33% 17% 17% -33% 17% 17% 8% 8% 8% -42% 8% 8% 8% 8% 8% 8% 8% -42% 8% 8% 8% 8% 8% 8% 8%
42% 42%
% 25% 25% 25% 25% 25% 25% 25% 25% 17% 17% 17% 17% 17% 17% 17% 17% 8% 8% 8% 8% 8% 8% 8% 8% 8% 8% 8% 8% 8% 8% 8% 8% 8% 8% 8%
2008-2017 n = 12 5 5 3 3 3 3 3 3 3 3 2 2 2 2 2 2 2 2 1 1 1 1 1 1 1 1 1 1 1 1 1 1 1 1 1 1 1
Variable Left ventricular function Peripheral arterial disease Comb. arterial disease Comb. any MI variable Comb. heart failure variables Comb. CHF or NYHA Comb. vessel disease Comb. graft variables Body size measurements Congestive heart failure Number of diseased vessels Preoperative IABP use Immunosuppression Date or order of surgery On- vs. off-pump CABG Prior/recent PCI or PTCA Intraoperative variables Postoperative variables
Age Gender Diabetes Renal failure Urgency Lung disease Neurologic disease NYHA class History of MI Atrial arrhythmia Repeat operation Angina Number of grafts Valve disease Hypertension Race or ethnicity Smoking status Left main disease Cardiogenic shock
Δa 39% 39% 28% 17% 17% 17% 17% 17% 6% 44% 44% -6% 44% 44% 33% 33% -28% 22% -28% 11% 11% 11% 11% 11% 11% 11% -39% 11% 11% 11% 11% 11% 11% 11% 11% 11% 11%
% 89% 89% 78% 67% 67% 67% 67% 67% 56% 44% 44% 44% 44% 44% 33% 33% 22% 22% 22% 11% 11% 11% 11% 11% 11% 11% 11% 11% 11% 11% 11% 11% 11% 11% 11% 11% 11%
n = 9 8 8 7 6 6 6 6 6 5 4 4 4 4 4 3 3 2 2 2 1 1 1 1 1 1 1 1 1 1 1 1 1 1 1 1 1 1
1998-2007
Variable Left ventricular function Comb. heart failure variables Congestive heart failure Comb. arterial disease Comb. CHF or NYHA Peripheral arterial disease Body size measurements Postoperative variables Comb. graft variables Hypercholesterolemia Comb. vessel disease Date or order of surgery Aortic cross-clamp duration Digoxin or digitalis use Left ventricular hypertrophy Intraoperative variables Preoperative diuretic use Ventri
Age Diabetes Renal failure Lung disease Neurologic disease Smoking status Type of graft(s) Left main disease Gender Urgency Repeat operation Number of grafts Valve disease Hypertension Heart rate Functional state Calcified aorta Comb. HTN or BP
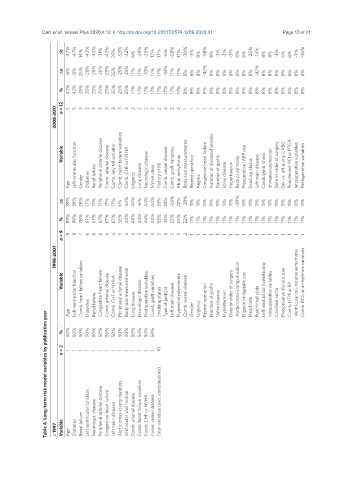
Table 4. Long-term risk model variables by publication year
% 50% 50% 50% 50% 50% 50% 50% 50% 50% 50% 50% 50% 50% 50%
n = 2 1 1 1 1 1 1 1 1 1 1 1 1 1 1 10
≤ 1997 Variable Age Diabetes Renal failure Left ventricular function Neurologic disease Peripheral arterial disease Congestive heart failure Left main disease Aortic cross-clamp duration Ventricular wall motion Comb. arterial disease Comb. heart failure variables Comb. CHF or NYHA Comb. vessel disease Total variables (excl. combinations)