
Page 342 - Read Online
P. 342
Kumar et al. Vessel Plus 2019;3:35 I http://dx.doi.org/10.20517/2574-1209.2019.006 Page 5 of 13
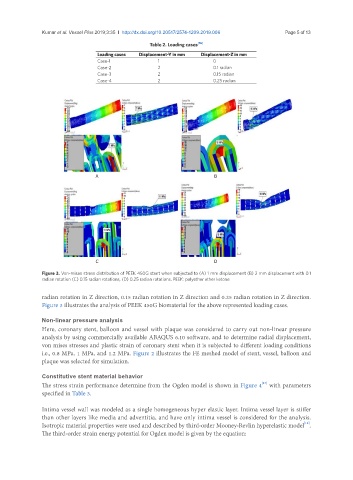
Table 2. Loading cases [16]
Loading cases Displacement-Y in mm Displacement-Z in mm
Case-1 1 0
Case-2 2 0.1 radian
Case-3 2 0.15 radian
Case-4 2 0.25 radian
A B
C D
Figure 3. Von-mises stress distribution of PEEK 450G stent when subjected to (A) 1 mm displacement (B) 2 mm displacement with 0.1
radian rotation (C) 0.15 radian rotations, (D) 0.25 radian rotations. PEEK: polyether ether ketone
radian rotation in Z direction, 0.15 radian rotation in Z direction and 0.25 radian rotation in Z direction.
Figure 3 illustrates the analysis of PEEK 450G biomaterial for the above represented loading cases.
Non-linear pressure analysis
Here, coronary stent, balloon and vessel with plaque was considered to carry out non-linear pressure
analysis by using commercially available ABAQUS 6.10 software, and to determine radial displacement,
von mises stresses and plastic strain of coronary stent when it is subjected to different loading conditions
i.e., 0.8 MPa, 1 MPa, and 1.2 MPa. Figure 2 illustrates the FE meshed model of stent, vessel, balloon and
plaque was selected for simulation.
Constitutive stent material behavior
[17]
The stress strain performance determine from the Ogden model is shown in Figure 4 with parameters
specified in Table 3.
Intima vessel wall was modeled as a single homogeneous hyper elastic layer. Intima vessel layer is stiffer
than other layers like media and adventitia, and have only intima vessel is considered for the analysis.
[18]
Isotropic material properties were used and described by third-order Mooney-Revlin hyperelastic model .
The third-order strain energy potential for Ogden model is given by the equation: