
Page 256 - Read Online
P. 256
Nemtsova et al. Vessel Plus 2018;2:27 I http://dx.doi.org/10.20517/2574-1209.2018.48 Page 5 of 9
6
5.23 5.39
Up to 60 years
5
More than 60 years
4
3.4
3.04
3
2.14
1.78
2
1.24
1.08
1
0
TC, mmol/L TG, mmol/L HDL cholesterol, LDL cholesterol,
mmol/L mmol/L
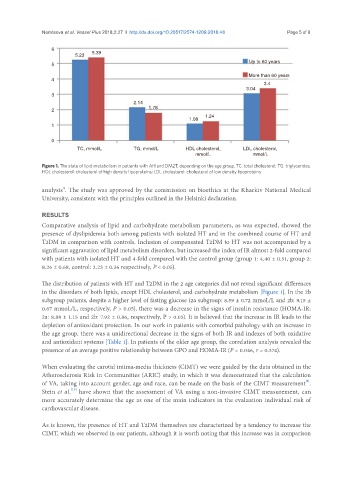
Figure 1. The state of lipid metabolism in patients with AH and DM2T, depending on the age group. TC: total cholesterol; TG: triglycerides;
HDL cholesterol: cholesterol of high density lipoproteins; LDL cholesterol: cholesterol of low density lipoproteins
analysis”. The study was approved by the commission on bioethics at the Kharkiv National Medical
University, consistent with the principles outlined in the Helsinki declaration.
RESULTS
Comparative analysis of lipid and carbohydrate metabolism parameters, as was expected, showed the
presence of dyslipidemia both among patients with isolated HT and in the combined course of HT and
T2DM in comparison with controls. Inclusion of compensated T2DM to HT was not accompanied by a
significant aggravation of lipid metabolism disorders, but increased the index of IR almost 2-fold compared
with patients with isolated HT and 4-fold compared with the control group (group 1: 4.40 ± 0.51, group 2:
8.26 ± 0.68, control: 2.23 ± 0.36 respectively, P < 0.05).
The distribution of patients with HT and T2DM in the 2 age categories did not reveal significant differences
in the disorders of both lipids, except HDL cholesterol, and carbohydrate metabolism [Figure 1]. In the 2b
subgroup patients, despite a higher level of fasting glucose (2a subgroup: 8.59 ± 0.72 mmoL/L and 2b: 9.15 ±
0.67 mmoL/L, respectively, P > 0.05), there was a decrease in the signs of insulin resistance (HOMA-IR:
2a: 8.88 ± 1.15 and 2b: 7.92 ± 0.86, respectively, P > 0.05). It is believed that the increase in IR leads to the
depletion of antioxidant protection. In our work in patients with comorbid pathology with an increase in
the age group, there was a unidirectional decrease in the signs of both IR and indexes of both oxidative
and antioxidant systems [Table 1]. In patients of the older age group, the correlation analysis revealed the
presence of an average positive relationship between GPO and HOMA-IR (P = 0.046, r = 0.374).
When evaluating the carotid intima-media thickness (CIMT) we were guided by the data obtained in the
Atherosclerosis Risk in Communities (ARIC) study, in which it was demonstrated that the calculation
[2]
of VA, taking into account gender, age and race, can be made on the basis of the CIMT measurement .
[13]
Stein et al. have shown that the assessment of VA using a non-invasive CIMT measurement, can
more accurately determine the age as one of the main indicators in the evaluation individual risk of
cardiovascular disease.
As is known, the presence of HT and T2DM themselves are characterized by a tendency to increase the
CIMT, which we observed in our patients, although it is worth noting that this increase was in comparison