
Page 258 - Read Online
P. 258
Nemtsova et al. Vessel Plus 2018;2:27 I http://dx.doi.org/10.20517/2574-1209.2018.48 Page 7 of 9
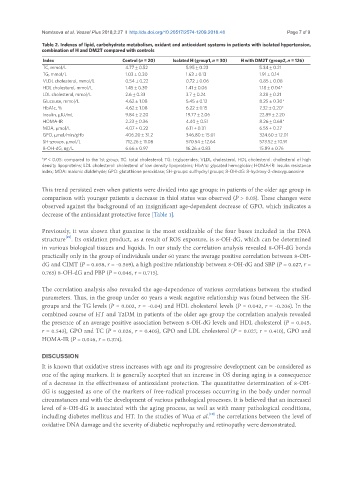
Table 2. Indexes of lipid, carbohydrate metabolism, oxidant and antioxidant systems in patients with isolated hypertension,
combination of H and DM2T compared with controls
Index Control (n = 20) Isolated H (group1, n = 30) H with DM2T (group2, n = 126)
TC, mmol/L 4.77 ± 0.52 5.95 ± 0.23 5.34 ± 0.21
TG, mmol/L 1.03 ± 0.30 1.63 ± 0.13 1.91 ± 0.14
VLDL cholesterol, mmol/L 0.54 ± 0.22 0.72 ± 0.06 0.85 ± 0.08
HDL cholesterol, mmol/L 1.45 ± 0.30 1.41 ± 0.06 1.18 ± 0.04*
LDL cholesterol, mmol/L 2.6 ± 0.33 3.7 ± 0.24 3.28 ± 0.21
Glucouse, mmol/L 4.62 ± 1.08 5.45 ± 0.12 8.25 ± 0.30*
HbA1c, % 4.62 ± 1.08 6.22 ± 0.15 7.32 ± 0.20*
Insulin, μIU/mL 9.84 ± 2.20 19.77 ± 2.06 22.89 ± 2.20
HOMA-IR 2.23 ± 0.36 4.40 ± 0.51 8.26 ± 0.68*
MDA, μmol/L 4.07 ± 0.22 6.11 ± 0.31 6.55 ± 0.27
GPO, μmol/min/gHb 406.20 ± 31.2 346.80 ± 15.01 324.60 ± 12.01
SH-groups, μmol/L 712.26 ± 11.08 570.54 ± 12.64 573.52 ± 10.91
8-OH-dG, ng/L 6.66 ± 0.97 16.26 ± 0.83 15.89 ± 0.76
*P < 0.05: compared to the 1st group; TC: total cholesterol; TG: triglycerides; VLDL cholesterol, HDL cholesterol: cholesterol of high
density lipoproteins; LDL cholesterol: cholesterol of low density lipoproteins; HbA1c: glycated hemoglobin; HOMA-IR: insulin resistance
index; MDA: malonic dialdehyde; GPO: glutathione peroxidase; SH-groups: sulfhydryl groups; 8-OH-dG: 8-hydroxy-2-deoxyguanosine
This trend persisted even when patients were divided into age groups: in patients of the older age group in
comparison with younger patients a decrease in thiol status was observed (P > 0.05). These changes were
observed against the background of an insignificant age-dependent decrease of GPO, which indicates a
decrease of the antioxidant protective force [Table 1].
Previously, it was shown that guanine is the most oxidizable of the four bases included in the DNA
[19]
structure . Its oxidation product, as a result of ROS exposure, is 8-OH-dG, which can be determined
in various biological tissues and liquids. In our study the correlation analysis revealed 8-OH-dG bonds
practically only in the group of individuals under 60 years: the average positive correlation between 8-OH-
dG and CIMT (P = 0.038, r = -0.569), a high positive relationship between 8-OH-dG and SBP (P = 0.027, r =
0.765) 8-OH-dG and PBP (P = 0.046, r = 0.715).
The correlation analysis also revealed the age-dependence of various correlations between the studied
parameters. Thus, in the group under 60 years a weak negative relationship was found between the SH-
groups and the TG levels (P = 0.002, r = -0.04) and HDL cholesterol levels (P = 0.042, r = -0.206). In the
combined course of HT and T2DM in patients of the older age group the correlation analysis revealed
the presence of an average positive association between 8-OH-dG levels and HDL cholesterol (P = 0.045,
r = 0.543), GPO and TC (P = 0.026, r = 0.405), GPO and LDL cholesterol (P = 0.027, r = 0.410), GPO and
HOMA-IR (P = 0.046, r = 0.374).
DISCUSSION
It is known that oxidative stress increases with age and its progressive development can be considered as
one of the aging markers. It is generally accepted that an increase in OS during aging is a consequence
of a decrease in the effectiveness of antioxidant protection. The quantitative determination of 8-OH-
dG is suggested as one of the markers of free-radical processes occurring in the body under normal
circumstances and with the development of various pathological processes. It is believed that an increased
level of 8-OH-dG is associated with the aging process, as well as with many pathological conditions,
[19]
including diabetes mellitus and HT. In the studies of Wua et al. the correlations between the level of
oxidative DNA damage and the severity of diabetic nephropathy and retinopathy were demonstrated.