
Page 94 - Read Online
P. 94
Shalimova Cardiovascular remodeling in EH and DM2
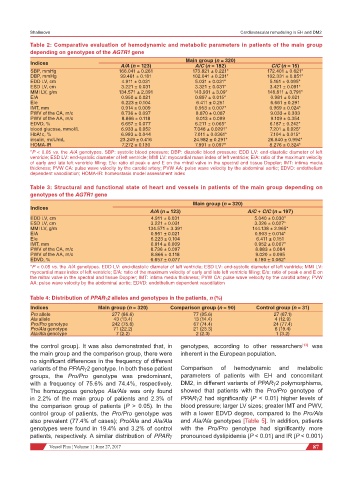
Table 2: Comparative evaluation of hemodynamic and metabolic parameters in patients of the main group
depending on genotypes of the AGTR1 gene
Main group (n = 320)
Indices
A/A (n = 123) A/C (n = 182) C/C (n = 15)
SBP, mmHg 166.041 ± 0.261 173.821 ± 0.221* 172.401 ± 0.621*
DBP, mmHg 99.461 ± 0.181 102.041 ± 0.231* 102.331 ± 0.851*
EDD LV, cm 4.911 ± 0.031 5.031 ± 0.031* 5.161 ± 0.095*
ESD LV, cm 3.221 ± 0.031 3.321 ± 0.031* 3.421 ± 0.091*
MMI LV, g/m 134.571 ± 2.391 143.931 ± 3.09* 146.611 ± 3.791*
E/A 0.950 ± 0.021 0.897 ± 0.015* 0.981 ± 0.021
E/e 6.223 ± 0.104 6.411 ± 0.251 6.661 ± 0.291
IMT, mm 0.914 ± 0.009 0.953 ± 0.007* 0.969 ± 0.024*
PWV of the CA, m/c 8.736 ± 0.097 8.870 ± 0.087 9.033 ± 0.333
PWV of the AA, m/c 8.866 ± 0.118 9.013 ± 0.099 9.109 ± 0.354
EDVD, % 6.657 ± 0.077 6.211 ± 0.065* 6.187 ± 0.242*
blood glucose, mmol/L 6.933 ± 0.052 7.046 ± 0.0291* 7.201 ± 0.025*
HbA1c, % 6.993 ± 0.044 7.011 ± 0.0361* 7.104 ± 0.015*
insulin, mcU/mL 23.249 ± 0.416 24.982 ± 0.291* 26.840 ± 0.994*
HOMA-IR 7.272 ± 0.130 7.991 ± 0.097* 8.276 ± 0.324*
*P < 0.05 vs. the A/A genotypes. SBP: systolic blood pressure; DBP: diastolic blood pressure; EDD LV: end-diastolic diameter of left
ventricle; ESD LV: end-systolic diameter of left ventricle; MMI LV: myocardial mass index of left ventricle; E/A: ratio of the maximum velocity
of early and late left ventricle filling; E/e: ratio of peak e and E on the mitral valve in the spectral and tissue Doppler; IMT: intima media
thickness; PVW CA: pulse wave velocity by the carotid artery; PVW AA: pulse wave velocity by the abdominal aortic; EDVD: endothelium
dependent vasodilation; HOMA-IR: homeostasis model assessment index
Table 3: Structural and functional state of heart and vessels in patients of the main group depending on
genotypes of the AGTR1 gene
Main group (n = 320)
Indices
A/A (n = 123) A/C + C/C (n = 197)
EDD LV, cm 4.911 ± 0.031 5.040 ± 0.030*
ESD LV, cm 3.221 ± 0.031 3.326 ± 0.027*
MMI LV, g/m 134.571 ± 3.391 144.138 ± 2.965*
E/A 0.951 ± 0.021 0.903 ± 0.014*
E/e 6.223 ± 0.104 6.411 ± 0.151
IMT, mm 0.914 ± 0.009 0.952 ± 0.007*
PWV of the CA, m/c 8.736 ± 0.097 8.883 ± 0.084
PWV of the AA, m/c 8.866 ± 0.118 9.020 ± 0.095
EDVD, % 6.657 ± 0.077 6.180 ± 0.062*
*P < 0.05 vs. the A/A genotypes. EDD LV: end-diastolic diameter of left ventricle; ESD LV: end-systolic diameter of left ventricle; MMI LV:
myocardial mass index of left ventricle; E/A: ratio of the maximum velocity of early and late left ventricle filling; E/e: ratio of peak e and E on
the mitral valve in the spectral and tissue Doppler; IMT: intima media thickness; PVW CA: pulse wave velocity by the carotid artery; PVW
AA: pulse wave velocity by the abdominal aortic; EDVD: endothelium dependent vasodilation
Table 4: Distribution of PPARγ2 alleles and genotypes in the patients, n (%)
Indices Main group (n = 320) Comparison group (n = 90) Control group (n = 31)
Pro allele 277 (86.6) 77 (85.6) 27 (87.1)
Ala allele 43 (13.4) 13 (14.4) 4 (12.9)
Pro/Pro genotype 242 (75.6) 67 (74.4) 24 (77.4)
Pro/Ala genotype 71 (22.2) 21 (23.3) 6 (19.4)
Ala/Ala genotype 7 (2.2) 2 (2.3) 1 (3.2)
the control group). It was also demonstrated that, in genotypes, according to other researchers was
[13]
the main group and the comparison group, there were inherent in the European population.
no significant differences in the frequency of different
variants of the PPARγ2 genotype. In both these patient Comparison of hemodynamic and metabolic
groups, the Pro/Pro genotype was predominant, parameters of patients with EH and concomitant
with a frequency of 75.6% and 74.4%, respectively. DM2, in different variants of PPARγ2 polymorphisms,
The homozygous genotype Ala/Ala was only found showed that patients with the Pro/Pro genotype of
in 2.2% of the main group of patients and 2.3% of PPARγ2 had significantly (P < 0.01) higher levels of
the comparison group of patients (P > 0.05). In the blood pressure; larger LV sizes; greater IMT and PWV,
control group of patients, the Pro/Pro genotype was with a lower EDVD degree, compared to the Pro/Ala
also prevalent (77.4% of cases); Pro/Ala and Ala/Ala and Ala/Ala genotypes [Table 5]. In addition, patients
genotypes were found in 19.4% and 3.2% of control with the Pro/Pro genotype had significantly more
patients, respectively. A similar distribution of PPARγ pronounced dyslipidemia (P < 0.01) and IR (P < 0.001)
Vessel Plus ¦ Volume 1 ¦ June 27, 2017 87