
Page 136 - Read Online
P. 136
Rao. Vessel Plus 2022;6:26 https://dx.doi.org/10.20517/2574-1209.2021.93 Page 5 of 43
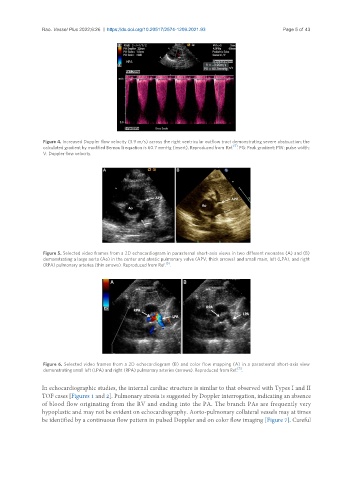
Figure 4. Increased Doppler flow velocity (3.9 m/s) across the right ventricular outflow tract demonstrating severe obstruction; the
[5]
calculated gradient by modified Bernoulli equation is 60.7 mmHg (insert). Reproduced from Ref. . PG: Peak gradient; PW: pulse width;
V: Doppler flow velocity.
Figure 5. Selected video frames from a 2D echocardiogram in parasternal short-axis views in two different neonates (A) and (B)
demonstrating a large aorta (Ao) in the center and atretic pulmonary valve (APV; thick arrows) and small main, left (LPA), and right
[5]
(RPA) pulmonary arteries (thin arrows). Reproduced from Ref. .
Figure 6. Selected video frames from a 2D echocardiogram (B) and color flow mapping (A) in a parasternal short-axis view
[5]
demonstrating small left (LPA) and right (RPA) pulmonary arteries (arrows). Reproduced from Ref. .
In echocardiographic studies, the internal cardiac structure is similar to that observed with Types I and II
TOF cases [Figures 1 and 2]. Pulmonary atresia is suggested by Doppler interrogation, indicating an absence
of blood flow originating from the RV and ending into the PA. The branch PAs are frequently very
hypoplastic and may not be evident on echocardiography. Aorto-pulmonary collateral vessels may at times
be identified by a continuous flow pattern in pulsed Doppler and on color flow imaging [Figure 7]. Careful