
Page 153 - Read Online
P. 153
Page 8 of 15 Dokko et al. Vessel Plus 2022;6:53 https://dx.doi.org/10.20517/2574-1209.2022.11
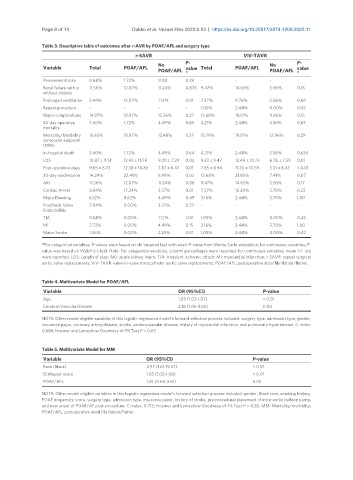
Table 3. Descriptive table of outcomes after r-AVR by POAF/AFL and surgery type
r-SAVR ViV-TAVR
No P- No P-
Variable Total POAF/AFL value Total POAF/AFL value
POAF/AFL POAF/AFL
* *
Permanent stroke 0.68% 1.72% 0.00 0.39 - - - -
Renal failure with or 11.56% 12.07% 11.24% 0.878 9.47% 14.63% 5.56% 0.16
without dialysis
Prolonged ventilation 5.44% 12.07% 1.12% 0.01 7.37% 9.76% 5.56% 0.69
Repeat procedure - - - - 1.05% 2.44% 0.00% 0.43
Major complications 14.97% 18.97% 12.36% 0.27 13.68% 19.51% 9.26% 0.15
30-day operative 3.40% 1.72% 4.49% 0.65 4.21% 2.44% 5.56% 0.63
mortality
Mortality/Morbidity 15.65% 18.97% 13.48% 0.37 15.79% 19.51% 12.96% 0.39
composite endpoint
(MM)
In-hospital death 3.40% 1.72% 4.49% 0.64 4.21% 2.44% 5.56% 0.634
LOS 10.87 ± 9.51 13.43 ± 11.78 9.20 ± 7.29 0.02 9.23 ± 9.47 12.49 ± 10.73 6.76 ± 7.59 0.01
Post-operative days 9.65 ± 8.73 12.38 ± 10.85 7.87 ± 6.47 0.01 7.85 ± 8.94 11.20 ± 10.59 5.31 ± 6.47 < 0.01
30-day readmission 14.29% 22.41% 8.99% 0.02 13.68% 21.95% 7.41% 0.07
AKI 11.56% 12.07% 11.24% 0.88 9.47% 14.63% 5.56% 0.17
Cardiac Arrest 8.84% 17.24% 3.37% 0.01 7.37% 12.20% 3.70% 0.23
Major Bleeding 6.12% 8.62% 4.49% 0.49 3.16% 2.44% 3.70% 1.00
Prosthetic Valve 2.04% 0.00% 3.37% 0.27 - - - -
Endocarditis
TIA 0.68% 0.00% 1.12% 1.00 1.05% 2.44% 0.00% 0.43
MI 2.72% 0.00% 4.49% 0.15 3.16% 2.44% 3.70% 1.00
Major Stroke 1.36% 0.00% 2.25% 0.51 1.05% 2.44% 0.00% 0.42
*For categorical variables, P-values were based on chi-squared test with exact P-value from Monte Carlo simulation; for continuous variables, P-
value was based on Welch’s t-test. Note: For categorical variables, column percentages were reported; for continuous variables, mean +/- std
were reported. LOS: Length of stay; AKI: acute kidney injury; TIA: transient ischemic attack; MI: myocardial infarction; r-SAVR: repeat surgical
aortic valve replacements; ViV-TAVR: valve-in-valve transcatheter aortic valve replacements; POAF/AFL: postoperative atrial fibrillation/flutter.
Table 4. Multivariate Model for POAF/AFL
Variable OR (95%CI) P-value
Age 1.05 (1.03-1.07) < 0.01
Cerebral Vascular Disease 2.18 (1.05-4.55) 0.04
NOTE: Other model eligible variables in this logistic regression model’s forward selection process included: surgery type, admission type, gender,
insurance payor, coronary artery disease, stroke, cerebrovascular disease, history of myocardial infarction, and pulmonary hypertension. C-index:
0.686; Hosmer and Lemeshow Goodness-of-Fit Test P = 0.07.
Table 5. Multivariate Model for MM
Variable OR (95%CI) P-value
Race (Black) 4.97 (1.61-15.37) < 0.01
Elixhauser score 1.05 (1.02-1.08) < 0.01
POAF/AFL 1.25 (0.60-2.61) 0.55
NOTE: Other model eligible variables in this logistic regression model’s forward selection process included: gender, Black race, smoking history,
POAF propensity score, surgery type, admission type, insurance payor, history of stroke, pre-procedural placement of intra-aortic balloon pump,
and new onset of POAF/AF post-procedure. C-index: 0.713; Hosmer and Lemeshow Goodness-of-Fit Test P = 0.85. MM: Mortality/morbidity;
POAF/AFL: postoperative atrial fibrillation/flutter.