
Page 152 - Read Online
P. 152
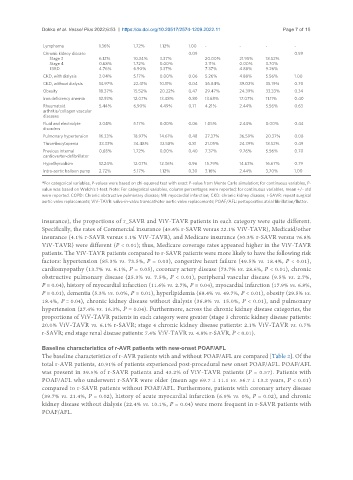
Dokko et al. Vessel Plus 2022;6:53  https://dx.doi.org/10.20517/2574-1209.2022.11  Page 7 of 15

                Lymphoma          1.36%       1.72%    1.12%     1.00  -          -        -        -
                Chronic kidney disease                           0.09                               0.59
                      Stage 3     6.12%       10.34%   3.37%          20.00%      21.95%   18.52%
                      Stage 4     0.68%       1.72%    0.00%          2.11%       0.00%    3.70%
                      ESRD        4.76%       6.90%    3.37%          7.37%       4.88%    9.26%
                CKD, with dialysis  2.04%     5.17%    0.00%     0.06  5.26%      4.88%    5.56%    1.00
                CKD, without dialysis  14.97%  22.41%  10.11%    0.04  36.84%     39.02%   35.19%   0.70
                Obesity           18.37%      15.52%   20.22%    0.47  29.47%     24.39%   33.33%   0.34
                Iron deficiency anemia  12.93%  12.07%  13.48%   0.80  13.68%     17.07%   11.11%   0.40
                Rheumatoid        5.44%       6.90%    4.49%     0.71  4.21%      2.44%    5.56%    0.63
                arthritis/collagen vascular
                diseases
                Fluid and electrolyte   2.04%  5.17%   0.00%     0.06  1.05%      2.44%    0.00%    0.44
                disorders
                Pulmonary hypertension  16.33%  18.97%  14.61%   0.48  27.37%     36.59%   20.37%   0.08
                Thrombocytopenia  33.33%      34.48%   32.58%    0.81  21.05%     24.39%   18.52%   0.49
                Previous internal   0.68%     1.72%    0.00%     0.40  7.37%      9.76%    5.56%    0.70
                cardioverter-defibrillator
                Hypothyroidism    12.24%      12.07%   12.36%    0.96  15.79%     14.63%   16.67%   0.79
                Intra-aortic balloon pump  2.72%  5.17%  1.12%   0.30  3.16%      2.44%    3.70%    1.00
               *For categorical variables, P-values were based on chi-squared test with exact P-value from Monte Carlo simulation; for continuous variables, P-
               value was based on Welch’s t-test. Note: For categorical variables, column percentages were reported; for continuous variables, mean +/- std
               were reported. COPD: Chronic obstructive pulmonary disease; MI: myocardial infarction; CKD: chronic kidney disease; r-SAVR: repeat surgical
               aortic valve replacements; ViV-TAVR: valve-in-valve transcatheter aortic valve replacements; POAF/AFL: postoperative atrial fibrillation/flutter.


               insurance), the proportions of r_SAVR and ViV-TAVR patients in each category were quite different.
               Specifically, the rates of Commercial insurance (45.6% r-SAVR versus 22.1% ViV-TAVR), Medicaid/other
               insurance (4.1% r-SAVR versus 1.1% ViV-TAVR), and Medicare insurance (50.3% r-SAVR versus 76.8%
               ViV-TAVR) were different (P < 0.01); thus, Medicare coverage rates appeared higher in the ViV-TAVR
               patients. The ViV-TAVR patients compared to r-SAVR patients were more likely to have the following risk
               factors: hypertension (85.3% vs. 73.5%, P = 0.03), congestive heart failure (49.5% vs. 18.4%, P < 0.01),
               cardiomyopathy (13.7% vs. 6.1%, P = 0.05), coronary artery disease (73.7% vs. 28.6%, P < 0.01), chronic
               obstructive pulmonary disease (25.3% vs. 7.5%, P < 0.01), peripheral vascular disease (9.5% vs. 2.7%,
               P = 0.04), history of myocardial infarction (11.6% vs. 2.7%, P = 0.04), myocardial infarction (17.9% vs. 6.8%,
               P = 0.01), dementia (5.3% vs. 0.0%, P = 0.01), hyperlipidemia (68.4% vs. 49.7%, P < 0.01), obesity (29.5% vs.
               18.4%, P = 0.04), chronic kidney disease without dialysis (36.8% vs. 15.0%, P < 0.01), and pulmonary
               hypertension (27.4% vs. 16.3%, P = 0.04). Furthermore, across the chronic kidney disease categories, the
               proportions of ViV-TAVR patients in each category were greater (stage 3 chronic kidney disease patients:
               20.0% ViV-TAVR vs. 6.1% r-SAVR; stage 4 chronic kidney disease patients: 2.1% ViV-TAVR vs. 0.7%
               r-SAVR; end stage renal disease patients: 7.4% ViV-TAVR vs. 4.8% r-SAVR, P < 0.01).


               Baseline characteristics of r-AVR patients with new-onset POAF/AFL
               The baseline characteristics of r-AVR patients with and without POAF/AFL are compared [Table 2]. Of the
               total r-AVR patients, 40.91% of patients experienced post-procedural new onset POAF/AFL. POAF/AFL
               was present in 39.5% of r-SAVR patients and 43.2% of ViV-TAVR patients (P = 0.57). Patients with
               POAF/AFL who underwent r-SAVR were older (mean age 69.7 ± 11.1 vs. 56.7 ± 13.2 years, P < 0.01)
               compared to r-SAVR patients without POAF/AFL. Furthermore, patients with coronary artery disease
               (39.7% vs. 21.4%, P = 0.02), history of acute myocardial infarction (6.9% vs. 0%, P = 0.02), and chronic
               kidney disease without dialysis (22.4% vs. 10.1%, P = 0.04) were more frequent in r-SAVR patients with
               POAF/AFL.