


Page 71 - Read Online
P. 71
Barioli et al. Vessel Plus 2024;8:13  https://dx.doi.org/10.20517/2574-1209.2023.68   Page 9 of 14

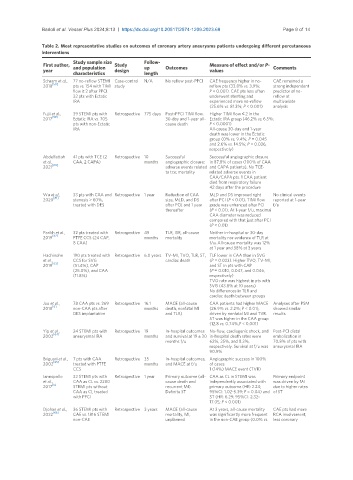
               Table 2. Most representative studies on outcomes of coronary artery aneurysms patients undergoing different percutaneous
               interventions
                          Study sample size       Follow-
                First author,   and population   Study   up   Outcomes  Measure of effect and/or P-  Comments
                year      characteristics  design  length               values

                Schram et al.,   77 no-reflow STEMI  Case-control   N/A  No reflow post-PPCI  CAE frequency higher in no-  CAE remained a
                   [58]
                2018      pts vs. 154 with TIMI  study                  reflow pts (33.8% vs. 3.9%;   strong independent
                          flow ≥ 2 after PPCI.                          P < 0.001). CAE pts less often   predictor of no-
                          32 pts with Ectatic                           underwent stenting and   reflow at
                          IRA                                           experienced more no-reflow   multivariate
                                                                        (25.6% vs. 81.3%; P < 0.001)  analysis
                Fujii et al.,   39 STEMI pts with   Retrospective 775 days  Post-PPCI TIMI flow.   Higher TIMI flow ≤ 2 in the
                2017 [59]  Ectatic IRA vs. 705           30-day and 1-year all- Ectatic IRA group (46.2% vs.6.5%;
                          pts with non-Ectatic           cause death    P < 0.0001)
                          IRA                                           All-cause 30-day and 1-year
                                                                        death was lower in the Ectatic
                                                                        group (0% vs. 9.4%; P = 0.045
                                                                        and 2.6% vs. 14.5%; P = 0.036,
                                                                        respectively)
                Abdelfattah   41 pts with TCE (2   Retrospective 10   Successful   Successful angiographic closure
                et al.,    CAA, 2 CAPA)           months  angiographic closure;  in 87.8% of cases (100% of CAA
                2021 [60]                                adverse events related  and CAPA patients). No TCE-
                                                         to tce; mortality  related adverse events in
                                                                        CAA/CAPA pts. 1 CAA patient
                                                                        died from respiratory failure
                                                                        42 days after the procedure
                Wu et al.,  33 pts with CAA and  Retrospective 1 year  Reduction of CAA   MLD and DS improved right  No clinical events
                2020 [61]  stenosis > 60%,               size, MLD, and DS   after PCI (P < 0.01). TIMI flow  reported at 1-year
                          treated with DES               after PCI, and 1 year   grade was enhanced after PCI      f/u
                                                         thereafter     (P < 0.01). At 1-year f/u, maximal
                                                                        CAA diameter was reduced
                                                                        compared with that just after PCI
                                                                        (P < 0.01)
                Parikh et al.,   32 pts treated with   Retrospective 49   TLR, ISR, all-cause   Neither in-hospital or 30-day
                2019 [62]  PTFE CCS (24 CAP,      months  mortality     mortality nor evidence of TLR at
                          8 CAA)                                        f/u. All-cause mortality was 12%
                                                                        at 1 year and 38% at 3 years
                Hachinohe    190 pts treated with  Retrospective 6.0 years TV-MI, TVO, TLR, ST,  TLF lower in CAA than in SVG
                et al.,   CCS for SVG                    cardiac death   (P = 0.023). Higher TVO, TV-MI,
                   [63]
                2019      (51.4%), CAP                                  and ST in pts with CAP
                          (25.0%), and CAA                              (P = 0.010, 0.047, and 0.046,
                          (11.8%)                                       respectively)
                                                                        TVO rate was highest in pts with
                                                                        SVG (43.8% at 10 years)
                                                                        No differences in TLR and
                                                                        cardiac death between groups
                Joo et al.,   78 CAA pts vs. 269   Retrospective 16.1   MACE (all-cause   CAA patients had higher MACE  Analyses after PSM
                2018 [6]  non-CAA pts after       months  death, nonfatal MI   (26.9% vs. 2.2%; P < 0.01),   showed similar
                          DES implantation               and TLR)       driven by nonfatal MI and TVR.   results
                                                                        ST was higher in the CAA group
                                                                        (12.8 vs. 0.74%,P < 0.001)
                Yip et al.,   24 STEMI pts with   Retrospective 19   In-hospital outcomes  No-flow, cardiogenic shock, and  Post-PCI distal
                   [64]
                2002      aneurysmal IRA          months  and survival at 19 ± 30  in-hospital death rates were   embolization in
                                                         months f/u     62%, 25%, and 8.3%,   70.8% of pts with
                                                                        respectively. Survival at f/u was  aneurysmal IRA
                                                                        90.9%
                Briguori et al.,  7 pts with CAA   Retrospective 35   In-hospital outcomes,  Angiographic success in 100%
                2002 [65]  treated with PTFE      months  and MACE at f/u  of cases
                          CCS                                           1 (14%) MACE event (TVR)
                Iannopollo    32 STEMI pts with   Retrospective 1 year  Primary outcome (all- CAA as CL in STEMI was   Primary endpoint
                et al.,   CAA as CL vs. 2280             cause death and   independently associated with   was driven by MI
                   [5]
                2017      STEMI pts without              recurrent MI).   primary outcome (HR: 2.24;   due to higher rates
                          CAA as CL treated              Definite ST    95%CI: 1.02-5.39; P = 0.04) and  of ST
                          with PPCI                                     ST (HR: 6.29; 95%CI: 2.32-
                                                                        17.05; P < 0.001)
                Djohan et al.,   36 STEMI pts with   Retrospective 3 years  MACE (all-cause   At 3 years, all-cause mortality  CAE pts had more
                   [66]
                2022      CAE vs. 1816 STEMI             mortality, MI,   was significantly more frequent  RCA involvement,
                          non-CAE                        unplanned      in the non-CAE group (0.0% vs.  less coronary

