


Page 23 - Read Online
P. 23
Andò et al. Vessel Plus 2023;7:15  https://dx.doi.org/10.20517/2574-1209.2023.26  Page 5 of 22


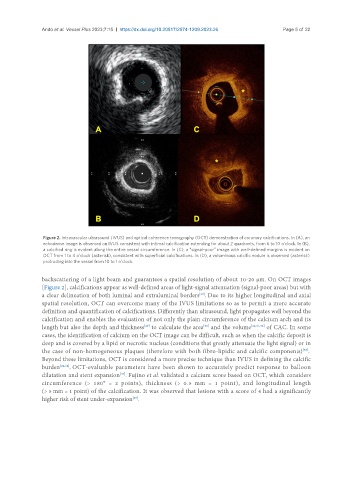
                Figure 2. Intravascular ultrasound (IVUS) and optical coherence tomography (OCT) demonstration of coronary calcifications. In (A), an
                echodense image is observed on IVUS consistent with intimal calcification extending for about 2 quadrants, from 6 to 10 o’clock. In (B),
                a calcified ring is evident along the entire vessel circumference. In (C), a “signal-poor” image with well-defined margins is evident on
                OCT from 1 to 4 o’clock (asterisk), consistent with superficial calcifications. In (D), a voluminous calcific nodule is observed (asterisk)
                protruding into the vessel from 10 to 1 o’clock.

               backscattering of a light beam and guarantees a spatial resolution of about 10-20 μm. On OCT images
               [Figure 2], calcifications appear as well-defined areas of light-signal attenuation (signal-poor areas) but with
               a clear delineation of both luminal and extraluminal borders . Due to its higher longitudinal and axial
                                                                    [28]
               spatial resolution, OCT can overcome many of the IVUS limitations so as to permit a more accurate
               definition and quantification of calcifications. Differently than ultrasound, light propagates well beyond the
               calcification and enables the evaluation of not only the plain circumference of the calcium arch and its
               length but also the depth and thickness  to calculate the area  and the volume [24,31,32]  of CAC. In some
                                                                      [30]
                                                  [29]
               cases, the identification of calcium on the OCT image can be difficult, such as when the calcific deposit is
               deep and is covered by a lipid or necrotic nucleus (conditions that greatly attenuate the light signal) or in
               the case of non-homogeneous plaques (therefore with both fibro-lipidic and calcific components) .
                                                                                                       [33]
               Beyond these limitations, OCT is considered a more precise technique than IVUS in defining the calcific
               burden [24,34] . OCT-evaluable parameters have been shown to accurately predict response to balloon
                                         [35]
               dilatation and stent expansion . Fujino et al. validated a calcium score based on OCT, which considers
               circumference  (>  180°  =  2  points),  thickness  (>  0.5  mm  =  1  point),  and  longitudinal  length
               (> 5 mm = 1 point) of the calcification. It was observed that lesions with a score of 4 had a significantly
               higher risk of stent under-expansion .
                                              [29]

