
Page 52 - Read Online
P. 52
Page 6 of 11 Perezgrovas-Olaria et al. Vessel Plus 2023;7:10 https://dx.doi.org/10.20517/2574-1209.2022.54
Table 3. Postoperative outcomes
Overall bCVG mCVG
Variable P -value
(n = 1,210) (n = 798) (n = 412)
In-hospital events
Operative mortality 8 (0.7) 3 (0.4) 5 (1.2) 0.18
a
Major adverse events 75 (6.2) 48 (6.0) 27 (6.6) 0.81
Myocardial infarction 3 (0.2) 2 (0.3) 1 (0.2) 1
Cerebrovascular accident 8 (0.7) 6 (0.8) 2 (0.5) 0.87
Dialysis 9 (0.7) 7 (0.9) 2 (0.5) 0.69
Tracheostomy 8 (0.7) 5 (0.6) 3 (0.7) 1
Re-exploration for bleeding 49 (4.0) 32 (4.0) 17 (4.1) 1
Follow-up events
Mortality 143 (11.8) 75 (9.4) 68 (16.5) < 0.001
Reoperation 49 (4.0) 47 (5.9) 2 (0.5) 0.02 b
a
Variables are presented as count (%). Major adverse events include operative mortality, myocardial infarction, cerebrovascular accident, dialysis,
b
tracheostomy, and re-exploration for bleeding. P-value was calculated using the Fine and Grey method (competing risk). bCVG: Biological
composite valve graft; mCVG: mechanical composite valve graft.
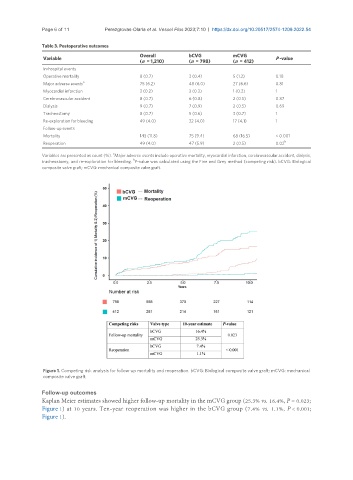
Figure 1. Competing risk analysis for follow-up mortality and reoperation. bCVG: Biological composite valve graft; mCVG: mechanical
composite valve graft.
Follow-up outcomes
Kaplan Meier estimates showed higher follow-up mortality in the mCVG group (25.3% vs. 16.4%, P = 0.023;
Figure 1) at 10 years. Ten-year reoperation was higher in the bCVG group (7.4% vs. 1.1%, P < 0.001;
Figure 1).