
Page 54 - Read Online
P. 54
Page 8 of 11 Perezgrovas-Olaria et al. Vessel Plus 2023;7:10 https://dx.doi.org/10.20517/2574-1209.2022.54
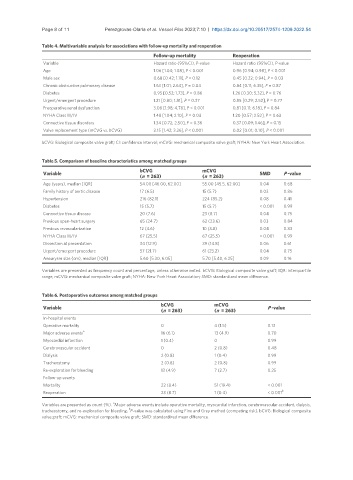
Table 4. Multivariable analysis for associations with follow-up mortality and reoperation
Follow-up mortality Reoperation
Variable Hazard ratio (95%CI), P-value Hazard ratio (95%CI), P-value
Age 1.06 [1.04; 1.08], P < 0.001 0.96 [0.94; 0.98], P < 0.001
Male sex 0.68 [0.42; 1.11], P = 0.12 0.45 [0.22; 0.94], P = 0.03
Chronic obstructive pulmonary disease 1.63 [1.01; 2.64], P = 0.04 0.84 [0.11; 6.35], P = 0.87
Diabetes 0.95 [0.52; 1.73], P = 0.86 1.26 [0.30; 5.32], P = 0.76
Urgent/emergent procedure 1.21 [0.80; 1.81], P = 0.37 0.85 [0.29; 2.52], P = 0.77
Preoperative renal dysfunction 3.08 [1.98; 4.78], P < 0.001 0.81 [0.11; 6.18], P = 0.84
NYHA Class III/IV 1.48 [1.04; 2.10], P = 0.03 1.20 [0.57; 2.52], P = 0.63
Connective tissue disorders 1.34 [0.72; 2.50], P = 0.36 0.37 [0.09; 1.46], P = 0.15
Valve replacement type (mCVG vs. bCVG) 2.15 [1.42; 3.26], P < 0.001 0.02 [0.01; 0.10], P < 0.001
bCVG: Biological composite valve graft; CI: confidence interval; mCVG: mechanical composite valve graft; NYHA: New York Heart Association.
Table 5. Comparison of baseline characteristics among matched groups
bCVG mCVG
Variable SMD P -value
(n = 263) (n = 263)
Age (years), median [IQR] 54.00 [46.00, 62.00] 55.00 [45.5, 62.00] 0.04 0.68
Family history of aortic disease 17 (6.5) 15 (5.7) 0.03 0.86
Hypertension 216 (82.1) 224 (85.2) 0.08 0.41
Diabetes 15 (5.7) 15 (5.7) < 0.001 0.99
Connective tissue disease 20 (7.6) 23 (8.7) 0.04 0.75
Previous open-heart surgery 65 (24.7) 62 (23.6) 0.03 0.84
Previous revascularization 12 (4.6) 10 (3.8) 0.04 0.83
NYHA Class III/IV 67 (25.5) 67 (25.5) < 0.001 0.99
Dissection at presentation 34 (12.9) 39 (14.8) 0.06 0.61
Urgent/emergent procedure 57 (21.7) 61 (23.2) 0.04 0.75
Aneurysm size (cm), median [IQR] 5.60 [5.30, 6.05] 5.70 [5.40, 6.25] 0.09 0.16
Variables are presented as frequency count and percentage, unless otherwise noted. bCVG: Biological composite valve graft; IQR: interquartile
range; mCVG: mechanical composite valve graft; NYHA: New York Heart Association; SMD: standardized mean difference.
Table 6. Postoperative outcomes among matched groups
bCVG mCVG
Variable (n = 263) (n = 263) P -value
In-hospital events
Operative mortality 0 4 (1.5) 0.13
a
Major adverse events 16 (6.1) 13 (4.9) 0.70
Myocardial infarction 1 (0.4) 0 0.99
Cerebrovascular accident 0 2 (0.8) 0.48
Dialysis 2 (0.8) 1 (0.4) 0.99
Tracheostomy 2 (0.8) 2 (0.8) 0.99
Re-exploration for bleeding 13 (4.9) 7 (2.7) 0.25
Follow-up events
Mortality 22 (8.4) 51 (19.4) < 0.001
b
Reoperation 23 (8.7) 1 (0.4) < 0.001
a
Variables are presented as count (%). Major adverse events include operative mortality, myocardial infarction, cerebrovascular accident, dialysis,
b
tracheostomy, and re-exploration for bleeding. P-value was calculated using Fine and Grey method (competing risk). bCVG: Biological composite
valve graft; mCVG: mechanical composite valve graft; SMD: standardized mean difference.