


Page 48 - Read Online
P. 48
Page 6 of 17                                                        Zhang et al. Soft Sci. 2026, 6, 16


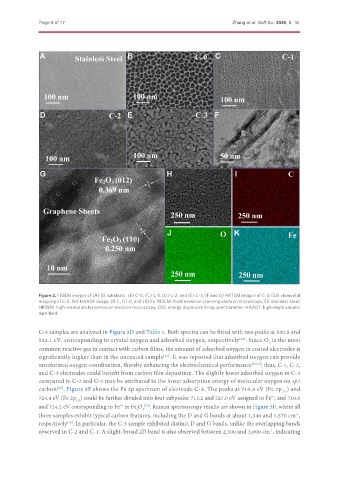
               Figure 2. FESEM images of (A) SS substrate, (B) C-0, (C) C-1, (D) C-2, and (E) C-3; (F and G) HRTEM images of C-3; EDS elemental
               mapping of C-3: (H) HAADF image, (I) C, (J) O, and (K) Fe. FESEM: Field emission scanning electron microscope; SS: stainless steel;
               HRTEM: high-resolution transmission electron microscopy; EDS: energy dispersive X-ray spectrometer; HAADF: high-angle annular
               dark-field.


               C-3 samples are analyzed in Figure 3D and Table 1. Both spectra can be fitted with two peaks at 530.5 and
               532.1 eV, corresponding to crystal oxygen and adsorbed oxygen, respectively . Since O  is the most
                                                                                     [24]
                                                                                               2
               common reactive gas in contact with carbon films, the amount of adsorbed oxygen in coated electrodes is
               significantly higher than in the uncoated sample . It was reported that adsorbed oxygen can provide
                                                          [25]
               unsaturated oxygen coordination, thereby enhancing the electrochemical performance [26,27] ; thus, C-1, C-2,
               and C-3 electrodes could benefit from carbon film deposition. The slightly lower adsorbed oxygen in C-3
               compared to C-2 and C-1 may be attributed to the lower adsorption energy of molecular oxygen on sp2
               carbon . Figure 3E shows the Fe 2p spectrum of electrode C-3. The peaks at 710.8 eV (Fe 2p ) and
                     [28]
                                                                                                    3/2
               724.4 eV (Fe 2p ) could be further divided into four subpeaks: 713.2 and 727.0 eV assigned to Fe , and 710.6
                                                                                                3+
                            1/2
               and 724.2 eV corresponding to Fe  in Fe O . Raman spectroscopy results are shown in Figure 3F, where all
                                                    [29]
                                           2+
                                                   4
                                                 3
               three samples exhibit typical carbon features, including the D and G bands at about 1,340 and 1,570 cm ,
                                                                                                         -1
               respectively . In particular, the C-3 sample exhibited distinct D and G bands, unlike the overlapping bands
                         [30]
               observed in C-2 and C-1. A slight, broad 2D band is also observed between 2,500 and 3,000 cm , indicating
                                                                                                -1

