
Page 158 - Read Online
P. 158
Page 6 of 9 Guess et al. Soft Sci 2023;3:23 https://dx.doi.org/10.20517/ss.2023.17
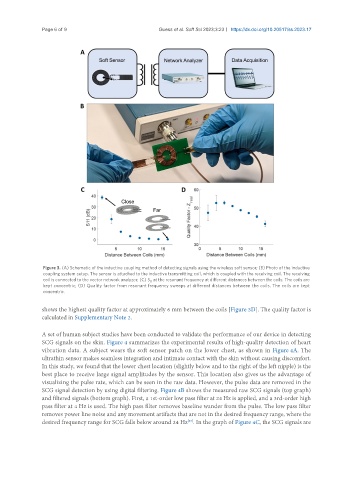
Figure 3. (A) Schematic of the inductive coupling method of detecting signals using the wireless soft sensor; (B) Photo of the inductive
coupling system setup. The sensor is attached to the inductive transmitting coil, which is coupled with the receiving coil. The receiving
coil is connected to the vector network analyzer; (C) S at the resonant frequency at different distances between the coils. The coils are
11
kept concentric; (D) Quality factor from resonant frequency sweeps at different distances between the coils. The coils are kept
concentric.
shows the highest quality factor at approximately 6 mm between the coils [Figure 3D]. The quality factor is
calculated in Supplementary Note 2.
A set of human subject studies have been conducted to validate the performance of our device in detecting
SCG signals on the skin. Figure 4 summarizes the experimental results of high-quality detection of heart
vibration data. A subject wears the soft sensor patch on the lower chest, as shown in Figure 4A. The
ultrathin sensor makes seamless integration and intimate contact with the skin without causing discomfort.
In this study, we found that the lower chest location (slightly below and to the right of the left nipple) is the
best place to receive large signal amplitudes by the sensor. This location also gives us the advantage of
visualizing the pulse rate, which can be seen in the raw data. However, the pulse data are removed in the
SCG signal detection by using digital filtering. Figure 4B shows the measured raw SCG signals (top graph)
and filtered signals (bottom graph). First, a 1st-order low pass filter at 24 Hz is applied, and a 3rd-order high
pass filter at 4 Hz is used. The high pass filter removes baseline wander from the pulse. The low pass filter
removes power line noise and any movement artifacts that are not in the desired frequency range, where the
[25]
desired frequency range for SCG falls below around 24 Hz . In the graph of Figure 4C, the SCG signals are