
Page 157 - Read Online
P. 157
Guess et al. Soft Sci 2023;3:23 https://dx.doi.org/10.20517/ss.2023.17 Page 5 of 9
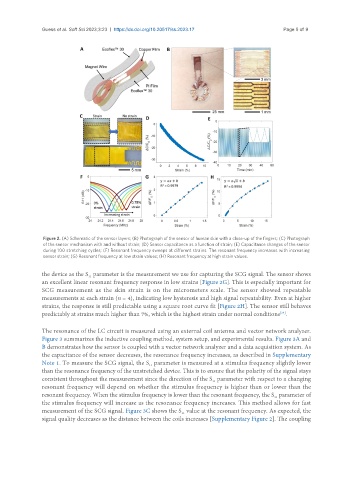
Figure 2. (A) Schematic of the sensor layers; (B) Photograph of the sensor of human skin with a close-up of the fingers; (C) Photograph
of the sensor mechanism with and without strain; (D) Sensor capacitance as a function of strain; (E) Capacitance changes of the sensor
during 100 stretching cycles; (F) Resonant frequency sweeps at different strains. The resonant frequency increases with increasing
sensor strain; (G) Resonant frequency at low strain values; (H) Resonant frequency at high strain values.
the device as the S parameter is the measurement we use for capturing the SCG signal. The sensor shows
11
an excellent linear resonant frequency response in low strains [Figure 2G]. This is especially important for
SCG measurement as the skin strain is on the micrometers scale. The sensor showed repeatable
measurements at each strain (n = 4), indicating low hysteresis and high signal repeatability. Even at higher
strains, the response is still predictable using a square root curve fit [Figure 2H]. The sensor still behaves
predictably at strains much higher than 7%, which is the highest strain under normal conditions .
[24]
The resonance of the LC circuit is measured using an external coil antenna and vector network analyzer.
Figure 3 summarizes the inductive coupling method, system setup, and experimental results. Figure 3A and
B demonstrates how the sensor is coupled with a vector network analyzer and a data acquisition system. As
the capacitance of the sensor decreases, the resonance frequency increases, as described in Supplementary
Note 1. To measure the SCG signal, the S parameter is measured at a stimulus frequency slightly lower
11
than the resonance frequency of the unstretched device. This is to ensure that the polarity of the signal stays
consistent throughout the measurement since the direction of the S parameter with respect to a changing
11
resonant frequency will depend on whether the stimulus frequency is higher than or lower than the
resonant frequency. When the stimulus frequency is lower than the resonant frequency, the S parameter of
11
the stimulus frequency will increase as the resonance frequency increases. This method allows for fast
measurement of the SCG signal. Figure 3C shows the S value at the resonant frequency. As expected, the
11
signal quality decreases as the distance between the coils increases [Supplementary Figure 2]. The coupling