
Page 55 - Read Online
P. 55
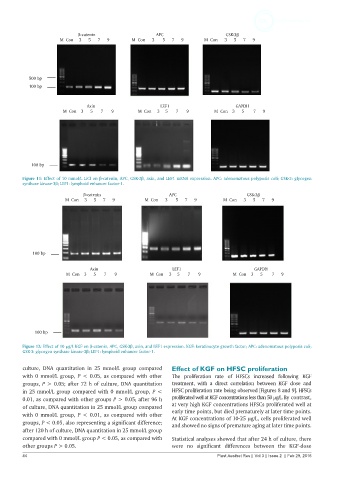
β-catenin                   APC                     GSK-3β
                      M  Con     3      5      7      9  M  Con      3       5      7      9  M  Con      3      5      7      9


           500 bp
           100 bp


                                Axin                     LEF1                       GAPDH
                       M  Con    3      5       7       9  M  Con     3     5       7       9  M  Con    3      5        7      9


            100 bp
         Figure 11: Effect of 10 mmol/L LiCl on β-catenin, APC, GSK-3β, axin, and LEF1 mRNA expression. APC: adenomatous polyposis coli; GSK-3: glycogen
         synthase kinase-3β; LEF1: lymphoid enhancer factor-1.
                              β-catenin                     APC                         GSK-3β
                        M  Con     3      5      7      9  M  Con      3       5      7      9  M  Con      3      5      7      9


            100 bp

                                 Axin                         LEF1                        GAPDH
                        M  Con    3      5       7       9  M  Con     3     5       7       9  M  Con    3      5        7      9


             100 bp

         Figure 12: Effect of 10 µg/L KGF on β-catenin, APC, GSK-3β, axin, and LEF1 expression. KGF: keratinocyte growth factor; APC: adenomatous polyposis coli;
         GSK-3: glycogen synthase kinase-3β; LEF1: lymphoid enhancer factor-1.


         culture, DNA quantitation  in 25 mmol/L  group compared   Effect of KGF on HFSC proliferation
         with 0 mmol/L group,  P < 0.05, as compared with other   The  proliferation  rate  of  HFSCs  increased  following  KGF
         groups, P > 0.05; after 72 h of culture, DNA quantitation   treatment,  with  a  direct  correlation  between  KGF  dose  and
         in 25 mmol/L group compared with 0 mmol/L group, P <   HFSC proliferation rate being observed [Figures 8 and 9]. HFSCs
         0.01, as compared with other groups P > 0.05; after 96 h   proliferated well at KGF concentrations less than 50 µg/L. By contrast,
         of culture, DNA quantitation in 25 mmol/L group compared   at very high KGF concentrations HFSCs proliferated well at
         with 0 mmol/L group,  P < 0.01, as compared with other   early time points, but died prematurely at later time points.
                                                             At KGF concentrations of 10-25 µg/L, cells proliferated well
         groups, P < 0.05, also representing a significant difference;   and showed no signs of premature aging at later time points.
         after 120 h of culture, DNA quantitation in 25 mmol/L group
         compared with 0 mmol/L group P < 0.05, as compared with   Statistical analyses showed that after 24 h of culture, there
         other groups P > 0.05.                              were no significant differences between the KGF-dose
         44                                                                  Plast Aesthet Res || Vol 3 || Issue 2  || Feb 29, 2016