
Page 52 - Read Online
P. 52
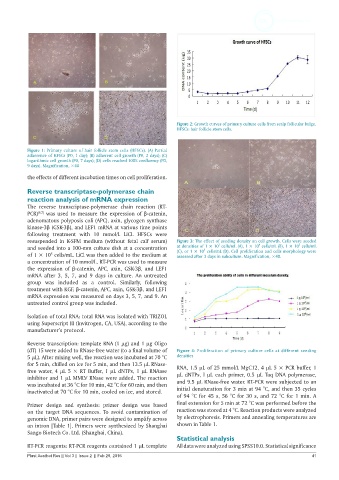
Figure 2: Growth curves of primary culture cells from scalp follicular bulge.
                                                               HFSCs: hair follicle stem cells.


           Figure 1: Primary culture of hair follicle stem cells (HFSCs). (A) Partial
           adherence of HFSCs (P0, 1 day); (B) adherent cell growth (P0, 3 days); (C)
           logarithmic cell growth (P0, 7 days); (D) cells reached 100% confluency (P0,
           9 days). Magnification, ×40
           the effects of different incubation times on cell proliferation.

           Reverse transcriptase-polymerase chain
           reaction analysis of mRNA expression
           The reverse  transcriptase-polymerase  chain reaction (RT-
           PCR) [6,7]  was used to measure the expression of β-catenin,
           adenomatous polyposis coli (APC), axin, glycogen synthase
           kinase-3β (GSK-3β), and LEF1 mRNA at various time points
           following treatment  with 10 mmol/L LiCl. HFSCs were
           resuspended in  K-SFM  medium  (without fetal calf serum)   Figure 3: The effect of seeding density on cell growth. Cells were seeded
                                                                                                          5
                                                                                            4
                                                                              3
           and seeded into a 100-mm culture dish at a concentration   at densities of 1 × 10  cells/mL (A), 1 × 10  cells/mL (B), 1 × 10  cells/mL
                                                                         6
           of 1 × 10  cells/mL. LiCl was then added to the medium at   (C), or 1 × 10  cells/mL (D). Cell proliferation and cells morphology were
                   5
                                                               assessed after 3 days in subculture. Magnification, ×40.
           a concentration of 10 mmol/L. RT-PCR was used to measure
           the  expression  of  β-catenin,  APC,  axin,  GSK-3β,  and LEF1
           mRNA  after  3, 5, 7, and 9 days in  culture.  An untreated
           group was included  as a control. Similarly, following
           treatment with KGF, β-catenin, APC, axin, GSK-3β, and LEF1
           mRNA expression was measured on days 3, 5, 7, and 9. An
           untreated control group was included.
           Isolation of total RNA: total RNA was isolated with TRIZOL
           using Superscript III (Invitrogen, CA, USA), according to the
           manufacturer’s protocol.
           Reverse transcription: template RNA (1 µg) and 1 µg Oligo
           (dT) 15 were added to RNase-free water (to a final volume of   Figure 4: Proliferation of primary culture cells at different seeding
           5 µL). After mixing well, the reaction was incubated at 70 °C   densities
           for 5 min, chilled on ice for 5 min, and then 13.5 µL RNase-  RNA, 1.5 µL of 25 mmol/L MgC12, 4 µL 5 × PCR buffer, 1
           free water, 4 µL 5 × RT Buffer, 1 µL dNTPs, 1 µL RNAase   µL dNTPs, l  µL each primer, 0.5  µL Taq DNA polymerase,
           inhibitor and 1 µL MMLV RNase were added. The reaction
           was incubated at 36 °C for 10 min, 42 °C for 60 min, and then   and 9.5 µL RNase-free water. RT-PCR were subjected to an
           inactivated at 70 °C for 10 min, cooled on ice, and stored.  initial denaturation for 3 min at 94 °C, and then 35 cycles
                                                               of 94 °C for 45 s, 56 °C for 30 s, and 72 °C for 1 min. A
           Primer  design  and synthesis:  primer  design  was  based   final extension for 5 min at 72 °C was performed before the
           on the target DNA sequences. To avoid contamination of   reaction was stored at 4 °C. Reaction products were analyzed
           genomic DNA, primer pairs were designed to amplify across   by electrophoresis. Primers and annealing temperatures are
           an intron [Table 1]. Primers were synthesized by Shanghai   shown in Table 1.
           Sango Biotech Co. Ltd. (Shanghai, China).
                                                               Statistical analysis
           RT-PCR reagents: RT-PCR reagents contained 1 µL template   All data were analyzed using SPSS10.0. Statistical significance
           Plast Aesthet Res || Vol 3 || Issue 2  || Feb 29, 2016                                              41