
Page 54 - Read Online
P. 54
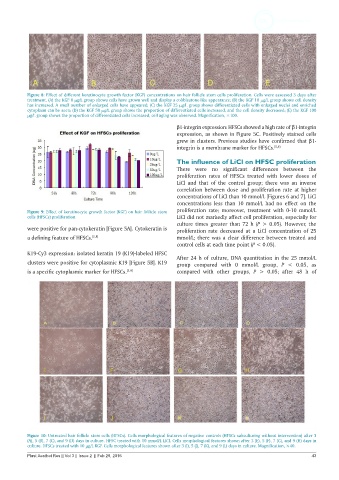
Figure 8: Effect of different keratinocyte growth factor (KGF) concentrations on hair follicle stem cells proliferation. Cells were assessed 3 days after
           treatment. (A) the KGF 0 µg/L group shows cells have grown well and display a cobblestone-like appearance; (B) the KGF 10 µg/L group shows cell density
           has increased. A small number of enlarged cells have appeared; (C) the KGF 25 µg/L group shows differentiated cells with enlarged nuclei and enriched
           cytoplasm can be seen; (D) the KGF 50 µg/L group shows the proportion of differentiated cells increased, and the cell density decreased; (E) the KGF 100
           µg/L group shows the proportion of differentiated cells increased, cell aging was observed. Magnification, ×100.
                                                               β1-integrin expression: HFSCs showed a high rate of β1-integrin
                                                               expression, as shown in Figure 5C. Positively stained cells
                                                               grew in clusters. Previous studies have confirmed that β1-
                                                               integrin is a membrane marker for HFSCs. [5,8]
                                                               The influence of LiCl on HFSC proliferation
                                                               There  were  no significant  differences between  the
                                                               proliferation  rates  of HFSCs  treated  with  lower doses of
                                                               LiCl  and that  of the  control group; there  was an inverse
                                                               correlation between dose and proliferation rate at higher
                                                               concentrations of LiCl than 10 mmol/L [Figures 6 and 7]. LiCl
                                                               concentrations less  than  10 mmol/L  had no effect on the
           Figure 9: Effect of keratinocyte growth factor (KGF) on hair follicle stem   proliferation  rate;  moreover,  treatment  with  0-10 mmol/L
           cells (HFSCs) proliferation                         LiCl did not markedly affect cell proliferation, especially for
                                                               culture times greater than 72 h (P > 0.05). However, the
           were positive for pan-cytokeratin [Figure 5A]. Cytokeratin is   proliferation rate decreased at a LiCl concentration of 25
           a defining feature of HFSCs. [5,8]                  mmol/L; there was a clear difference between treated and
                                                               control cells at each time point (P < 0.05).
           K19-Cy3 expression: isolated keratin 19 (K19)-labeled HFSC
                                                               After 24 h of culture, DNA quantitation in the 25 mmol/L
           clusters were positive for cytoplasmic K19 [Figure 5B]. K19   group compared with 0 mmol/L group,  P < 0.05, as
           is a specific cytoplasmic marker for HFSCs. [5,9]   compared  with  other  groups,  P  >  0.05; after  48 h  of


           Figure 10: Untreated hair follicle stem cells (HFSCs). Cells morphological features of negative controls (HFSCs subculturing without intervention) after 3
           (A), 5 (B), 7 (C), and 9 (D) days in culture. HFSC treated with 10 mmol/L LiCl. Cells morphological features shown after 3 (E), 5 (F), 7 (G), and 9 (H) days in
           culture. HFSCs treated with 10 µg/L KGF. Cells morphological features shown after 3 (I), 5 (J), 7 (K), and 9 (L) days in culture. Magnification, ×40.
           Plast Aesthet Res || Vol 3 || Issue 2  || Feb 29, 2016                                              43