
Page 297 - Read Online
P. 297
Zhu et al. Modified Robertson vs. Wise pattern
Late postop period (P < 0.05) Change over time (P < 0.05)
70.0 8.00
60.0 6.00
50.0 4.00
40.0 2.00
0.00
30.0 SNtoNIP (cm) NIPtoIMF (cm) TotVol (10 mL)
-2.00
20.0
-4.00
10.0
-6.00
0.0 NIPtoIMF (cm) NIPtoNIP (cm) MaxProj (cm) AreolaSA (cm ) SupPole% MedPole% ROB WISE
2
ROB WISE
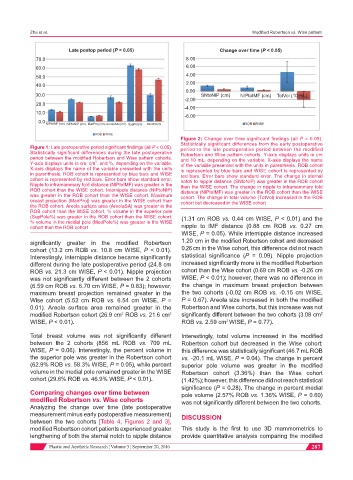
Figure 2: Change over time significant findings (all P < 0.05).
Statistically significant differences from the early postoperative
Figure 1: Late postoperative period significant findings (all P < 0.05). period to the late postoperative period between the modified
Statistically significant differences during the late postoperative Robertson and Wise pattern cohorts. Y-axis displays units in cm
period between the modified Robertson and Wise pattern cohorts. and 10 mL, depending on the variable. X-axis displays the name
2
Y-axis displays units in cm, cm , and %, depending on the variable. of the variable presented with the units in parenthesis. ROB cohort
X-axis displays the name of the variable presented with the units is represented by blue bars and WISE cohort is represented by
in parenthesis. ROB cohort is represented by blue bars and WISE red bars. Error bars show standard error. The change in sternal
cohort is represented by red bars. Error bars show standard error. notch to nipple distance (SNtoNIP) was greater in the ROB cohort
Nipple to inframammary fold distance (NIPtoIMF) was greater in the than the WISE cohort. The change in nipple to inframammary fold
ROB cohort than the WISE cohort. Internipple distance (NIPtoNIP) distance (NIPtoIMF) was greater in the ROB cohort than the WISE
was greater in the ROB cohort than the WISE cohort. Maximum cohort. The change in total volume (TotVol) increased in the ROB
breast projection (MaxProj) was greater in the WISE cohort than cohort but decreased in the WISE cohort
the ROB cohort. Areola surface area (AreolaSA) was greater in the
ROB cohort than the WISE cohort. % volume in the superior pole
(SupPole%) was greater in the ROB cohort than the WISE cohort. (1.31 cm ROB vs. 0.44 cm WISE, P < 0.01) and the
% volume in the medial pole (MedPole%) was greater in the WISE
cohort than the ROB cohort nipple to IMF distance (0.88 cm ROB vs. 0.27 cm
WISE, P = 0.05). While internipple distance increased
significantly greater in the modified Robertson 1.20 cm in the modified Robertson cohort and decreased
cohort (13.2 cm ROB vs. 10.8 cm WISE, P < 0.01). 0.26 cm in the Wise cohort, this difference did not reach
Interestingly, internipple distance became significantly statistical significance (P = 0.09). Nipple projection
different during the late postoperative period (24.8 cm increased significantly more in the modified Robertson
ROB vs. 21.3 cm WISE, P < 0.01). Nipple projection cohort than the Wise cohort (0.69 cm ROB vs. -0.26 cm
was not significantly different between the 2 cohorts WISE, P < 0.01); however, there was no difference in
(6.59 cm ROB vs. 6.70 cm WISE, P = 0.83); however, the change in maximum breast projection between
maximum breast projection remained greater in the the two cohorts (-0.02 cm ROB vs. -0.15 cm WISE,
Wise cohort (5.52 cm ROB vs. 6.54 cm WISE, P = P = 0.67). Areola size increased in both the modified
0.01). Areola surface area remained greater in the Robertson and Wise cohorts, but this increase was not
2
modified Robertson cohort (26.9 cm ROB vs. 21.6 cm significantly different between the two cohorts (3.08 cm
2
2
WISE, P < 0.01). ROB vs. 2.59 cm WISE, P = 0.77).
2
Total breast volume was not significantly different Interestingly, total volume increased in the modified
between the 2 cohorts (856 mL ROB vs. 709 mL Robertson cohort but decreased in the Wise cohort;
WISE, P = 0.06). Interestingly, the percent volume in this difference was statistically significant (46.7 mL ROB
the superior pole was greater in the Robertson cohort vs. -20.1 mL WISE, P = 0.04). The change in percent
(62.9% ROB vs. 58.3% WISE, P = 0.05), while percent superior pole volume was greater in the modified
volume in the medial pole remained greater in the WISE Robertson cohort (3.36%) than the Wise cohort
cohort (29.6% ROB vs. 46.9% WISE, P < 0.01). (1.42%); however, this difference did not reach statistical
significance (P = 0.28). The change in percent medial
Comparing changes over time between pole volume (2.57% ROB vs. 1.36% WISE, P = 0.60)
modified Robertson vs. Wise cohorts was not significantly different between the two cohorts.
Analyzing the change over time (late postoperative
measurement minus early postoperative measurement) DISCUSSION
between the two cohorts [Table 4, Figures 2 and 3],
modified Robertson cohort patients experienced greater This study is the first to use 3D mammometrics to
lengthening of both the sternal notch to nipple distance provide quantitative analysis comparing the modified
Plastic and Aesthetic Research ¦ Volume 3 ¦ September 20, 2016 287