
Page 296 - Read Online
P. 296
Zhu et al. Modified Robertson vs. Wise pattern
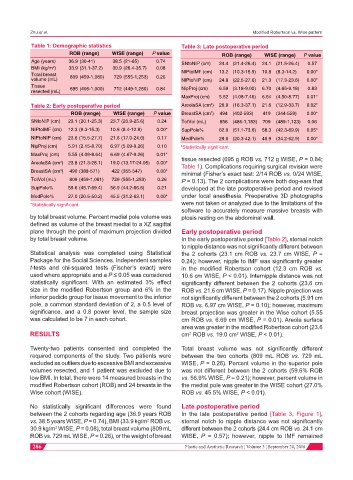
Table 1: Demographic statistics Table 3: Late postoperative period
ROB (range) WISE (range) P value ROB (range) WISE (range) P value
Age (years) 36.9 (30-41) 38.5 (21-65) 0.74 SNtoNIP (cm) 24.4 (21.4-26.4) 24.1 (21.5-26.4) 0.57
BMI (kg/m ) 33.9 (31.1-37.2) 30.9 (26.4-35.7) 0.08
2
Total breast 809 (459-1,080) 729 (555-1,253) 0.26 NIPtoIMF (cm) 13.2 (10.3-15.9) 10.8 (8.3-14.2) 0.00*
volume (mL) NIPtoNIP (cm) 24.8 (22.5-27.6) 21.3 (17.3-23.6) 0.00*
Tissue NipProj (cm) 6.59 (3.18-9.00) 6.70 (4.65-9.18) 0.83
resected (mL) 695 (406-1,000) 712 (449-1,280) 0.84
MaxProj (cm) 5.52 (4.08-7.46) 6.54 (4.50-8.77) 0.01*
2
Table 2: Early postoperative period AreolaSA (cm ) 26.9 (16.3-37.1) 21.6 (12.9-33.7) 0.02*
2
ROB (range) WISE (range) P value BreastSA (cm ) 494 (402-593) 419 (344-559) 0.00*
SNtoNIP (cm) 23.1 (20.1-25.3) 23.7 (20.9-25.6) 0.24 TotVol (mL) 856 (486-1,183) 709 (489-1,123) 0.06
NIPtoIMF (cm) 12.3 (9.3-15.3) 10.6 (8.4-12.9) 0.00* SupPole% 62.9 (51.1-73.6) 58.3 (42.3-69.9) 0.05*
NIPtoNIP (cm) 23.6 (15.5-27.7) 21.6 (17.0-24.6) 0.17 MedPole% 29.6 (20.3-42.1) 46.9 (34.2-62.9) 0.00*
NipProj (cm) 5.91 (2.15-8.70) 6.97 (5.09-9.26) 0.10 *Statistically significant
MaxProj (cm) 5.55 (4.09-8.64) 6.69 (4.67-9.26) 0.01* tissue resected (695 g ROB vs. 712 g WISE, P = 0.84;
AreolaSA (cm ) 23.8 (21.3-28.1) 19.0 (13.17-24.05) 0.00* Table 1). Complications requiring surgical revision were
2
BreastSA (cm ) 490 (388-571) 422 (355-547) 0.00* minimal (Fisher’s exact test: 2/14 ROB vs. 0/24 WISE,
2
TotVol (mL) 809 (459-1,081) 729 (555-1,253) 0.26 P = 0.13). The 2 complications were both dog-ears that
SupPole% 59.6 (45.7-69.4) 56.9 (44.2-66.6) 0.21 developed at the late postoperative period and revised
MedPole% 27.0 (20.5-50.2) 45.5 (31.2-63.1) 0.00* under local anesthesia. Preoperative 3D photographs
*Statistically significant were not taken or analyzed due to the limitations of the
software to accurately measure massive breasts with
by total breast volume. Percent medial pole volume was ptosis resting on the abdominal wall.
defined as volume of the breast medial to a XZ sagittal
plane through the point of maximum projection divided Early postoperative period
by total breast volume. In the early postoperative period [Table 2], sternal notch
to nipple distance was not significantly different between
Statistical analysis was completed using Statistical the 2 cohorts (23.1 cm ROB vs. 23.7 cm WISE, P =
Package for the Social Sciences. Independent samples 0.24); however, nipple to IMF was significantly greater
t-tests and chi-squared tests (Fischer’s exact) were in the modified Robertson cohort (12.3 cm ROB vs.
used where appropriate and a P ≤ 0.05 was considered 10.6 cm WISE, P < 0.01). Internipple distance was not
statistically significant. With an estimated 3% effect significantly different between the 2 cohorts (23.6 cm
size in the modified Robertson group and 6% in the ROB vs. 21.6 cm WISE, P = 0.17). Nipple projection was
inferior pedicle group for tissue movement to the inferior not significantly different between the 2 cohorts (5.91 cm
pole, a common standard deviation of 2, a 0.5 level of ROB vs. 6.97 cm WISE, P = 0.10); however, maximum
significance, and a 0.8 power level, the sample size breast projection was greater in the Wise cohort (5.55
was calculated to be 7 in each cohort. cm ROB vs. 6.69 cm WISE, P = 0.01). Areola surface
area was greater in the modified Robertson cohort (23.6
RESULTS cm ROB vs. 19.0 cm WISE, P < 0.01).
2
2
Twenty-two patients consented and completed the Total breast volume was not significantly different
required components of the study. Two patients were between the two cohorts (809 mL ROB vs. 729 mL
excluded as outliers due to excessive BMI and excessive WISE, P = 0.26). Percent volume in the superior pole
volumes resected, and 1 patient was excluded due to was not different between the 2 cohorts (59.6% ROB
low BMI. In total, there were 14 measured breasts in the vs. 56.9% WISE, P = 0.21); however, percent volume in
modified Robertson cohort (ROB) and 24 breasts in the the medial pole was greater in the WISE cohort (27.0%
Wise cohort (WISE). ROB vs. 45.5% WISE, P < 0.01).
No statistically significant differences were found Late postoperative period
between the 2 cohorts regarding age (36.9 years ROB In the late postoperative period [Table 3, Figure 1],
vs. 38.5 years WISE, P = 0.74), BMI (33.9 kg/m ROB vs. sternal notch to nipple distance was not significantly
2
30.9 kg/m WISE, P = 0.08), total breast volume (809 mL different between the 2 cohorts (24.4 cm ROB vs. 24.1 cm
2
ROB vs. 729 mL WISE, P = 0.26), or the weight of breast WISE, P = 0.57); however, nipple to IMF remained
286 Plastic and Aesthetic Research ¦ Volume 3 ¦ September 20, 2016