
Page 273 - Read Online
P. 273
a b
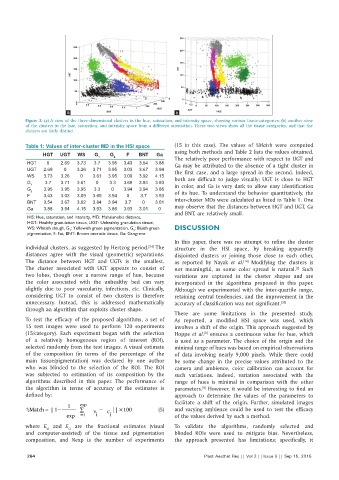
Figure 2: (a) A view of the three‑dimensional clusters in the hue, saturation, and intensity space, showing various tissue‑categories; (b) another view
of the clusters in the hue, saturation, and intensity space from a different orientation. These two views show all the tissue categories, and that the
clusters are fairly distinct
Table 1: Values of inter-cluster MD in the HSI space (15 in this case). The values of %Match were computed
HGT UGT WS G G F BNT Ga using both methods and Table 2 lists the values obtained.
1 2 The relatively poor performance with respect to UGT and
HGT 0 2.69 3.73 3.7 3.95 3.43 3.54 3.88 Ga may be attributed to the absence of a tight cluster in
UGT 2.69 0 3.26 3.71 3.95 3.03 3.67 3.94 the first case, and a large spread in the second. Indeed,
WS 3.73 3.26 0 3.61 3.95 3.09 3.92 4.15 both are difficult to judge visually; UGT is close to HGT
G 1 3.7 3.71 3.61 0 3.3 3.69 3.84 3.93
G 3.95 3.95 3.95 3.3 0 3.94 3.94 3.86 in color, and Ga is very dark to allow easy identification
2 of its hue. To understand the behavior quantitatively, the
F 3.43 3.03 3.09 3.69 3.94 0 3.7 3.93
BNT 3.54 3.67 3.92 3.84 3.94 3.7 0 3.01 inter‑cluster MDs were calculated as listed in Table 1. One
Ga 3.88 3.94 4.15 3.93 3.86 3.93 3.01 0 may observe that the distances between HGT and UGT, Ga
and BNT, are relatively small.
HIS: Hue, saturation, and intensity, MD: Mahalanobis distance,
HGT: Healthy granulation tissue, UGT: Unhealthy granulation tissue,
WS: Whitish slough, G : Yellowish green pigmentation, G : Bluish green DISCUSSION
2
1
pigmentation, F: Fat, BNT: Brown necrotic tissue, Ga: Gangrene
In this paper, there was no attempt to refine the cluster
individual clusters, as suggested by Hertzog period. The structure in the HSI space, by breaking apparently
[24]
distances agree with the visual (geometric) separations. disjointed clusters or joining those close to each other,
The distance between HGT and UGTs is the smallest. as reported by Nayak et al. Modifying the clusters is
[14]
The cluster associated with UGT appears to consist of not meaningful, as some color spread is natural. Such
[2]
two lobes, though over a narrow range of hue, because variations are captured in the cluster shapes and are
the color associated with the unhealthy bed can vary incorporated in the algorithms proposed in this paper.
slightly due to poor vascularity, infections, etc. Clinically, Although we experimented with the inter‑quartile range,
considering UGT to consist of two clusters is therefore retaining central tendencies, and the improvement in the
unnecessary. Instead, this is addressed mathematically accuracy of classification was not significant. [20]
through an algorithm that exploits cluster shape.
There are some limitations in the presented study.
To test the efficacy of the proposed algorithms, a set of As reported, a modified HSI space was used, which
15 test images were used to perform 120 experiments involves a shift of the origin. This approach suggested by
(15/category). Each experiment began with the selection Hoppe et al. ensures a continuous value for hue, which
[8]
of a relatively homogenous region of interest (ROI), is used as a parameter. The choice of the origin and the
selected randomly from the test images. A visual estimate minimal range of hues was based on empirical observations
of the composition (in terms of the percentage of the of data involving nearly 9,000 pixels. While there could
main tissue/pigmentation) was declared by one author be some change in the precise values attributed to the
who was blinded to the selection of the ROI. The ROI camera and ambience, color calibration can account for
was subjected to estimation of its composition by the such variations. Indeed, variation associated with the
algorithms described in this paper. The performance of range of hues is minimal in comparison with the other
the algorithm in terms of accuracy of the estimates is parameters. However, it would be interesting to find an
[8]
defined by: approach to determine the values of the parameters to
1 N exp facilitate a shift of the origin. Further, simulated images
%Match = [ 1 − ∑ |E v − E c | ] ×100 (5) and varying ambience could be used to test the efficacy
N exp i =1 i i of the values derived by such a method.
where E and E are the fractional estimates (visual To validate the algorithms, randomly selected and
Ci
Vi
and computer‑assisted) of the tissue and pigmentation blinded ROIs were used to mitigate bias. Nevertheless,
composition, and Nexp is the number of experiments the approach presented has limitations; specifically, it
264 Plast Aesthet Res || Vol 2 || Issue 5 || Sep 15, 2015