
Page 272 - Read Online
P. 272
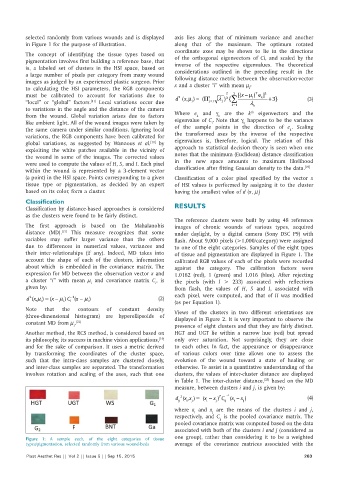
selected randomly from various wounds and is displayed   axis  lies  along that  of minimum  variance and another
          in Figure 1 for the purpose of illustration.        along that of the maximum. The optimum rotated
                                                              coordinate axes may be shown to lie in the directions
          The concept of identifying  the tissue  types based on
          pigmentation involves first building a reference base, that   of the  orthogonal eigenvectors of  Ci,  and scaled by  the
          is, a labeled set of clusters in the HSI space, based on   inverse  of  the  respective  eigenvalues.  The  theoretical
          a large number of pixels per category from many wound   considerations outlined in the preceding result in the
          images as judged by an experienced plastic surgeon. Prior   following distance metric between the observation‑vector
          to calculating  the HSI  parameters,  the  RGB components   x and a cluster “i” with mean µ: i
                                                                                           T
          must  be  calibrated  to  account  for variations  due  to   2  3     2 3  3  [(x −µ ) e k ] 2
                                                                                          i
          “local” or “global” factors.  Local variations occur due   d  ( ,x  µ= Π)  (  j =1  λ ) { ∑  λ  + 3}  (3)
                                                                               j
                                 [11]
                                                                    i
                                                                                   =1
                                                                                  k
          to variations in the angle and the distance of the camera                      th k
          from  the  wound.  Global variation  arises  due  to  factors   Where  e  and  γ  are the  k  eigenvectors  and the
                                                                      k
                                                                              k
          like ambient light. All of the wound images were taken by   eigenvalue of C. Note that γ  happens to be the variance
                                                                                       k
                                                                           i
          the same camera under similar conditions. Ignoring local   of the  sample points in  the  direction  of  e .  Scaling
                                                                                                       k
          variations, the RGB components have been calibrated for   the  transformed axes  by  the  inverse  of the  respective
          global variations,  as suggested  by  Wannous  et  al.  by   eigenvalues  is,  therefore,  logical. The relation of this
                                                      [11]
          exploiting the white patches available in the vicinity  of   approach to statistical decision theory is seen when one
          the  wound in  some  of the  images.  The corrected values   notes that the minimum (Euclidean) distance classification
          were used to compute the values of H, S, and I. Each pixel   in the new space amounts to maximum  likelihood
                                                                                                            [19]
          within the wound is represented by a 3‑element vector   classification after fitting Gaussian density to the data.
          (a point) in the HSI space. Points corresponding to a given   Classification  of  a  color pixel  specified  by  the  vector  x
          tissue  type  or pigmentation,  as decided by  an expert   of HSI  values is  performed by  assigning  it  to  the  cluster
          based on its color, form a cluster.                 having the smallest value of d (x, µ)
                                                                                            i
          Classification
          Classification  by  distance‑based  approaches is  considered   RESULTS
          as the clusters were found to be fairly distinct.
                                                              The reference clusters were built by using 48 reference
          The first approach is based on the Mahalanobis      images  of chronic wounds of various types, acquired
          distance  (MD).  This measure recognizes that some   under daylight, by a digital camera  (Sony DSC P9) with
                       [21]
          variables may suffer larger variance than the others   flash. About 9,000 pixels (>1,000/category) were assigned
          due  to  differences  in  numerical  values,  variances  and   to one of the eight categories. Samples of the eight types
          their  inter‑relationships  (if  any).  Indeed,  MD  takes  into   of tissue and pigmentation are displayed in Figure 1. The
          account  the shape of  each  of  the  clusters,  information   calibrated RGB values of each of the pixels were recorded
          about which  is embedded in the covariance matrix. The   against the category. The calibration factors were
          expression for MD between the observation vector x and   1.0162  (red),  1  (green)  and 1.016 (blue).  After  rejecting
          a cluster “i” with mean  µ  and covariance matrix  C , is   the pixels (with  I > 233)  associated  with reflections
                                                        i
                                 i
          given by:                                           from flash, the values of  H,  S and  I, associated with
                                                              each pixel, were computed, and that of  H was modified
          d 2 ( , )x µ  i  =x µ  ( −  i ) C i -1 (x µ  −  i )  (2)  (as per Equation 1).
          Note   that  the  contours  of   constant  density  Views of the clusters in two different orientations are
          (three‑dimensional histogram) are hyperellipsoids of   displayed in Figure 2. It is very important to observe the
          constant MD from µ. [22]
                           i                                  presence of eight clusters and that they are fairly distinct.
          Another method, the RCS method, is considered based on   HGT and UGT lie within  a narrow hue  (red) but  spread
          its philosophy, its success in machine vision applications,    only  over  saturation.  Not  surprisingly,  they  are  close
                                                         [19]
          and  for the sake of comparison. It uses a metric derived   to each other.  In  fact, the  appearance or disappearance
          by transforming the coordinates of the cluster space,   of various colors  over time  allows one to assess the
          such that the intra‑class samples are clustered closely,   evolution of the wound toward a state  of healing or
          and inter‑class samples are separated. The transformation   otherwise. To assist in a quantitative understanding of the
          involves rotation and scaling of the  axes,  such that  one   clusters, the values of inter‑cluster distance are displayed
                                                              in Table 1. The inter‑cluster distance,  based on the MD
                                                                                              [23]
                                                              measure, between clusters i and j, is given by:
                                                               d ij 2  x i  j  (x i  − ( , ) x =  j  T  ij  −1 (x i  − ) x C  j ) x  (4)

                                                              where  x and  x are the means of the clusters  i and  j,
                                                                            j
                                                                     i
                                                              respectively,  and C  is  the  pooled covariance matrix. The
                                                                              ij
                                                              pooled covariance matrix was computed based on the data
                                                              associated with both of the clusters i and j (considered as
                                                              one  group), rather  than  considering  it  to be  a  weighted
          Figure  1:  A  sample each, of the eight categories of tissue
          types/pigmentation, selected randomly from various wound‑beds  average of the covariance matrices associated with the
          Plast Aesthet Res || Vol 2 || Issue 5 || Sep 15, 2015                                             263