
Page 421 - Read Online
P. 421
Davis et al. Neuroimmunol Neuroinflammation 2018;5:50 I http://dx.doi.org/10.20517/2347-8659.2018.60 Page 5 of 11
C20 NHA
US IL-1β US IL-1β
29 kDa
TMEM119
55 kDa
β-tubulin
GFAP 51 kDa
β-tubulin 55 kDa
C20
A B C D
E F G H
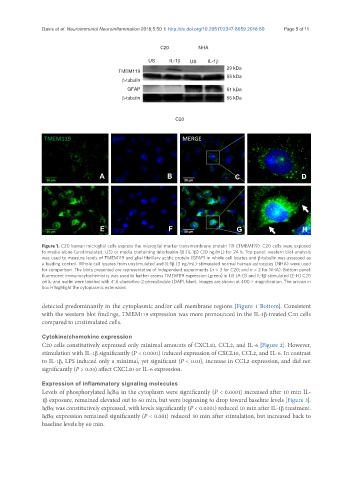
Figure 1. C20 human microglial cells express the microglial marker transmembrane protein 119 (TMEM119). C20 cells were exposed
to media alone (unstimulated; US) or media containing interleukin-1β (IL-1β) (20 ng/mL) for 24 h. Top panel: western blot analysis
was used to measure levels of TMEM119 and glial fibrillary acidic protein (GFAP) in whole cell lysates and β-tubulin was assessed as
a loading control. Whole cell lysates from unstimulated and IL-1β (3 ng/mL)-stimulated normal human astrocytes (NHA) were used
for comparison. The blots presented are representative of independent experiments (n = 3 for C20; and n = 2 for NHA). Bottom panel:
fluorescent immunocytochemistry was used to further assess TMEM119 expression (green) in US (A-D) and IL-1β-stimulated (E-H) C20
cells; and nuclei were labeled with 4′,6-diamidino-2-phenylindole (DAPI, blue). Images are shown at 400 × magnification. The arrows in
box H highlight the cytoplasmic extensions
detected predominantly in the cytoplasmic and/or cell membrane regions [Figure 1 Bottom]. Consistent
with the western blot findings, TMEM119 expression was more pronounced in the IL-1β-treated C20 cells
compared to unstimulated cells.
Cytokine/chemokine expression
C20 cells constitutively expressed only minimal amounts of CXCL10, CCL2, and IL-6 [Figure 2]. However,
stimulation with IL-1β significantly (P < 0.0001) induced expression of CXCL10, CCL2, and IL-6. In contrast
to IL-1β, LPS induced only a minimal, yet significant (P < 0.01), increase in CCL2 expression, and did not
significantly (P > 0.05) affect CXCL10 or IL-6 expression.
Expression of inflammatory signaling molecules
Levels of phosphorylated IκBα in the cytoplasm were significantly (P < 0.0001) increased after 10 min IL-
1β exposure, remained elevated out to 60 min, but were beginning to drop toward baseline levels [Figure 3].
IκBα was constitutively expressed, with levels significantly (P < 0.0001) reduced 10 min after IL-1β treatment.
IκBα expression remained significantly (P < 0.001) reduced 30 min after stimulation, but increased back to
baseline levels by 60 min.