
Page 258 - Read Online
P. 258
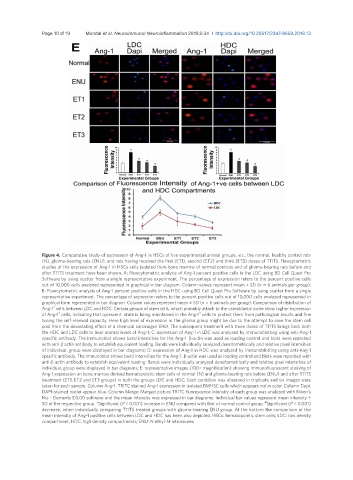
Page 10 of 19            Mondal et al. Neuroimmunol Neuroinflammation 2018;5:34  I  http://dx.doi.org/10.20517/2347-8659.2018.13


               Figure 4. Comparative study of expression of Ang-1 in HSCs of five experimental animal groups, viz., the normal, healthy control rats
               (N), glioma-bearing rats (ENU), and rats having received the first (ET1), second (ET2) and third (ET3) doses of T11TS. Flowcytometric
               studies of the expression of Ang-1 in HSCs cells isolated from bone marrow of normal controls and of glioma-bearing rats before and
               after T11TS treatment have been shown. A: Flowcytometric analysis of Ang-1 percent positive cells in the LDC using BD Cell Quest Pro
               Software by using scatter from a single representative experiment. The percentage of expression refers to the percent positive cells
               out of 10,000 cells analyzed represented in graphical in bar diagram. Column values represent mean ± SD (n = 6 animals per group);
               B: Flowcytometric analysis of Ang-1 percent positive cells in the HDC using BD Cell Quest Pro Software by using scatter from a single
               representative experiment. The percentage of expression refers to the percent positive cells out of 10,000 cells analyzed represented in
               graphical form represented in bar diagram. Column values represent mean ± SD (n = 6 animals per group). Comparison of distribution of
                   +
               Ang-1  cells between LDC and HDC: Certain groups of stem cells, which probably attach to the osteoblastic niche show higher expression
                                                                    +
               of Ang-1  cells, indicating that quiescent  state is being maintained in the Ang-1  cells to protect them from pathological insults and fine
                     +
               tuning the self-renewal capacity. Here high level of expression in the glioma group might be due to the attempt to save the stem cell
               pool from the devastating effect of a chemical carcinogen ENU. The subsequent treatment with three doses of T11TS brings back both
               the HDC and LDC cells to bear normal levels of Ang-1; C: expression of Ang-1 in LDC was analyzed by immunoblotting using anti-Ang-1
               specific antibody. The immunoblot shows band intensities for the Ang-1. β-actin was used as loading control and blots were reprobed
               with anti-β actin antibody to establish equivalent loading. Bands were individually analyzed densitometrically and relative pixel intensities
               of individual, group were displayed in bar diagrams; D: expression of Ang-1 in HDC was analyzed by immunoblotting using anti-Ang-1
               specific antibody. The immunoblot shows band intensities for the Ang-1. β-actin was used as loading control and blots were reprobed with
               anti-β actin antibody to establish equivalent loading. Bands were individually analyzed densitometrically and relative pixel intensities of
               individual, group were displayed in bar diagrams; E: representative images (100× magnification) showing immunofluorescent staining of
               Ang-1 expression on bone marrow derived hematopoietic stem cells of normal (N) and glioma-bearing rats before (ENU) and after T11TS
               treatment (ET1, ET2 and ET3 groups) in both the groups LDC and HDC. Each condition was observed in triplicate and six images were
               taken for each sample. Column Ang-1: TRITC stained Ang-1 expression in isolated BMHSC cells which appears red in color. Column Dapi:
               DAPI-stained nuclei appear blue. Column Merge: Merged picture TRITC fluorescence intensity of each group was analyzed with Nikon’s
               Nis - Elements D3.00 software and the mean intensity was expressed in bar diagrams. Individual bar values represent mean intensity ±
                                                                                          #
               SD of the respective group. *Significant (P < 0.001) increase in ENU compared with that of normal control group.  Significant (P < 0.001)
               decrease, when individually comparing T11TS treated groups with glioma-bearing ENU group. At the bottom the comparison of the
               mean intensity of Ang-1 positive cells between LDC and HDC has been also depicted. HSCs: hematopoietic stem cells; LDC: low density
               compartment; HDC: high density compartments; ENU: N-ethyl-N-nitrosourea