
Page 255 - Read Online
P. 255
Mondal et al. Neuroimmunol Neuroinflammation 2018;5:34 I http://dx.doi.org/10.20517/2347-8659.2018.13 Page 7 of 19
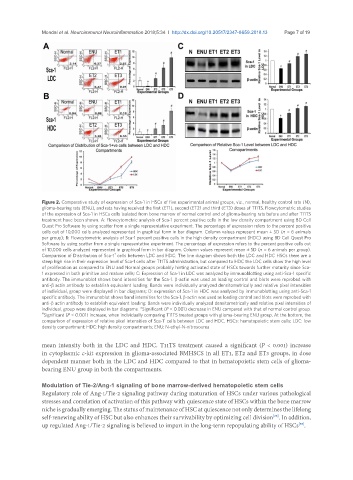
Figure 2. Comparative study of expression of Sca-1 in HSCs of five experimental animal groups, viz., normal, healthy control rats (N),
glioma-bearing rats (ENU), and rats having received the first (ET1), second (ET2) and third (ET3) doses of T11TS. Flowcytometric studies
of the expression of Sca-1 in HSCs cells isolated from bone marrow of normal control and of glioma-bearing rats before and after T11TS
treatment have been shown. A: Flowcytometric analysis of Sca-1 percent positive cells in the low density compartment using BD Cell
Quest Pro Software by using scatter from a single representative experiment. The percentage of expression refers to the percent positive
cells out of 10,000 cells analyzed represented in graphical form in bar diagram. Column values represent mean ± SD (n = 6 animals
per group); B: Flowcytometric analysis of Sca-1 percent positive cells in the high density compartment (HDC) using BD Cell Quest Pro
Software by using scatter from a single representative experiment. The percentage of expression refers to the percent positive cells out
of 10,000 cells analyzed represented in graphical form in bar diagram. Column values represent mean ± SD (n = 6 animals per group).
+
Comparison of Distribution of Sca-1 cells between LDC and HDC: The line diagram shows both the LDC and HDC HSCs there are a
steep high rise in their expression level of Sca-1 cells after T11TS administration, but compared to HDC the LDC cells show the high level
of proliferation as compared to ENU and Normal groups probably hinting activated state of HSCs towards further maturity since Sca-
1 expressed in both primitive and mature cells; C: Expression of Sca-1 in LDC was analyzed by immunoblotting using anti-Sca-1 specific
antibody. The immunoblot shows band intensities for the Sca-1. β-actin was used as loading control and blots were reprobed with
anti-β actin antibody to establish equivalent loading. Bands were individually analyzed densitometrically and relative pixel intensities
of individual, group were displayed in bar diagrams; D: expression of Sca-1 in HDC was analyzed by immunoblotting using anti-Sca-1
specific antibody. The immunoblot shows band intensities for the Sca-1. β-actin was used as loading control and blots were reprobed with
anti-β actin antibody to establish equivalent loading. Bands were individually analyzed densitometrically and relative pixel intensities of
individual, group were displayed in bar diagrams. *Significant (P < 0.001) decrease in ENU compared with that of normal control group.
# Significant (P < 0.001) increase, when individually comparing T11TS treated groups with glioma-bearing ENU group. At the bottom, the
+
comparison of expression of relative pixel intensities of Sca-1 cells between LDC and HDC. HSCs: hematopoietic stem cells; LDC: low
density compartment; HDC: high density compartments; ENU: N-ethyl-N-nitrosourea
mean intensity both in the LDC and HDC. T11TS treatment caused a significant (P < 0.001) increase
in cytoplasmic c-kit expression in glioma-associated BMHSCS in all ET1, ET2 and ET3 groups, in dose
dependent manner both in the LDC and HDC compared to that in hematopoietic stem cells of glioma-
bearing ENU group in both the compartments.
Modulation of Tie-2/Ang-1 signaling of bone marrow-derived hematopoietic stem cells
Regulatory role of Ang-1/Tie-2 signaling pathway during maturation of HSCs under various pathological
stresses and correlation of activation of this pathway with quiescence state of HSCs within the bone marrow
niche is gradually emerging. The status of maintenance of HSC at quiescence not only determines the lifelong
self-renewing ability of HSC but also enhances their survivability by optimizing cell division . In addition,
[28]
up regulated Ang-1/Tie-2 signaling is believed to impart in the long-term repopulating ability of HSCs .
[55]