
Page 102 - Read Online
P. 102
Zarei. Neuroimmunol Neuroinflammation 2018;5:13 I http://dx.doi.org/10.20517/2347-8659.2018.02 Page 5 of 10
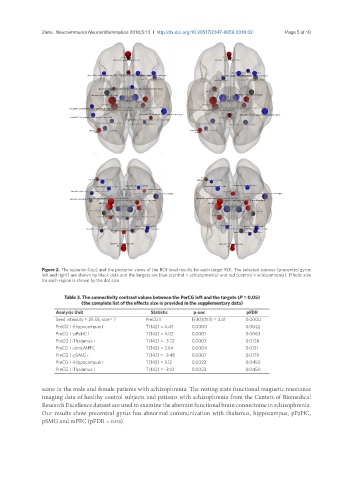
Figure 2. The superior (top) and the posterior views of the ROI-level results for each target ROI. The selected sources (precentral gyrus
left and right) are shown by black dots and the targets are blue (control > schizophrenia) and red (control < schizophrenia). Effects size
for each region is shown by the dot size
Table 3. The connectivity contrast values between the PerCG left and the targets (P = 0.05)
(the complete list of the effects size is provided in the supplementary data)
Analysis Unit Statistic p-unc pFDR
Seed intensity = 25.55, size= 7 PreCG l F(30)(113) = 3.41 0.0000
PreCG l -Hippocampus l T(142) = 4.47 0.0000 0.0022
PreCG l -pPaHC l T(142) = 4.02 0.0001 0.0063
PreCG l -Thalamus r T(142) = -3.72 0.0003 0.0128
PreCG l -dmn.MPFC T(142) = 3.64 0.0004 0.0131
PreCG l -pSMG r T(142) = -3.48 0.0007 0.0179
PreCG l -Hippocampus r T(142) = 3.12 0.0022 0.0450
PreCG l -Thalamus l T(142) = -3.10 0.0023 0.0450
same in the male and female patients with schizophrenia. The resting-state functional magnetic resonance
imaging data of healthy control subjects and patients with schizophrenia from the Centers of Biomedical
Research Excellence dataset are used to examine the aberrant functional brain connectome in schizophrenia.
Our results show precentral gyrus has abnormal communication with thalamus, hippocampus, pPaHC,
pSMG and mPFC (pFDR = 0.05).