
Page 100 - Read Online
P. 100
Zarei. Neuroimmunol Neuroinflammation 2018;5:13 I http://dx.doi.org/10.20517/2347-8659.2018.02 Page 3 of 10
Table 1. Demographic characteristics of subjects in COBRE data
N Age (SD) Female (%)
Patients with schizophrenia 72 38.16 (13.89) 0.19
Healthy control 74 35.82 (11.58) 0.31
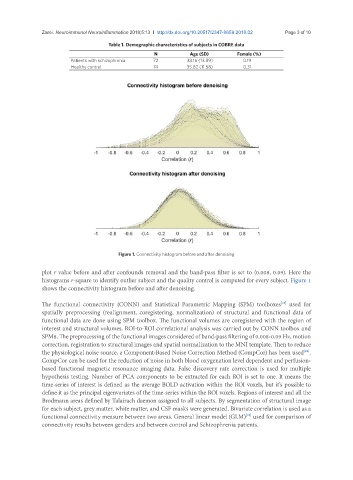
Figure 1. Connectivity histogram before and after denoising
plot r value before and after confounds removal and the band-pass filter is set to (0.008, 0.09). Here the
histograms r-square to identify outlier subject and the quality control is computed for every subject. Figure 1
shows the connectivity histogram before and after denoising.
[21]
The functional connectivity (CONN) and Statistical Parametric Mapping (SPM) toolboxes used for
spatially preprocessing (realignment, coregistering, normalization) of structural and functional data of
functional data are done using SPM toolbox. The functional volumes are coregistered with the region of
interest and structural volumes. ROI-to-ROI correlational analysis was carried out by CONN toolbox and
SPM8. The preprocessing of the functional images considered of band-pass filtering of 0.008-0.09 Hz, motion
correction, registration to structural images and spatial normalization to the MNI template. Then to reduce
the physiological noise source, a Component-Based Noise Correction Method (CompCor) has been used .
[22]
CompCor can be used for the reduction of noise in both blood oxygenation level dependent and perfusion-
based functional magnetic resonance imaging data. False discovery rate correction is used for multiple
hypothesis testing. Number of PCA components to be extracted for each ROI is set to one. It means the
time-series of interest is defined as the average BOLD activation within the ROI voxels, but it’s possible to
define it as the principal eigenvariates of the time-series within the ROI voxels. Regions of interest and all the
Brodmann areas defined by Talairach daemon assigned to all subjects. By segmentation of structural image
for each subject, grey matter, white matter, and CSF masks were generated. Bivariate correlation is used as a
functional connectivity measure between two areas. General linear model (GLM) used for comparison of
[23]
connectivity results between genders and between control and Schizophrenia patients.