
Page 101 - Read Online
P. 101
Page 4 of 10 Zarei. Neuroimmunol Neuroinflammation 2018;5:13 I http://dx.doi.org/10.20517/2347-8659.2018.02
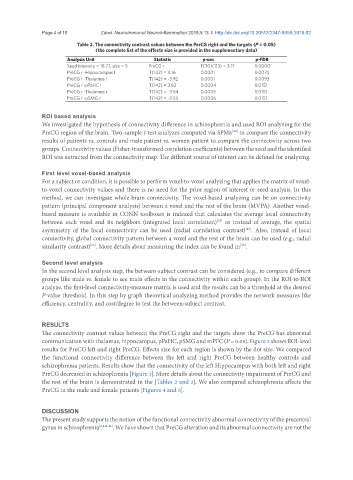
Table 2. The connectivity contrast values between the PerCG right and the targets (P = 0.05)
(the complete list of the effects size is provided in the supplementary data)
Analysis Unit Statistic p-unc p-FDR
Seed intensity = 18.77, size = 5 PreCG r F(30)(113) = 3.17 0.0000
PreCG r -Hippocampus l T(142) = 4.16 0.0001 0.0074
PreCG r -Thalamus l T(142) = -3.92 0.0001 0.0093
PreCG r -pPaHC l T(142) = 3.62 0.0004 0.0151
PreCG r -Thalamus r T(142) = -3.54 0.0005 0.0151
PreCG r -pSMG r T(142) = -3.53 0.0006 0.0151
ROI based analysis
We investigated the hypothesis of connectivity difference in schizophrenia and used ROI analyzing for the
PreCG region of the brain. Two-sample t-test analyzes computed via SPM8 to compare the connectivity
[24]
results of patients vs. controls and male patient vs. women patient to compare the connectivity across two
groups. Connectivity values (Fisher-transformed correlation coefficients) between the seed and the identified
ROI was extracted from the connectivity map. The different source of interest can be defined for analyzing.
First level voxel-based analysis
For a subject or condition, it is possible to perform voxel-to-voxel analyzing that applies the matrix of voxel-
to-voxel connectivity values and there is no need for the prior region of interest or seed analysis. In this
method, we can investigate whole-brain connectivity. The voxel-based analyzing can be on connectivity
pattern (principal component analysis) between a voxel and the rest of the brain (MVPA). Another voxel-
based measure is available in CONN toolboxes is indexed that calculates the average local connectivity
between each voxel and its neighbors (integrated local correlation) or instead of average, the spatial
[25]
asymmetry of the local connectivity can be used (radial correlation contrast) . Also, instead of local
[26]
connectivity, global connectivity pattern between a voxel and the rest of the brain can be used (e.g., radial
similarity contrast) . More details about measuring the index can be found in .
[27]
[28]
Second level analysis
In the second level analysis step, the between-subject contrast can be considered (e.g., to compare different
groups like male vs. female to see main effects in the connectivity within each group). In the ROI-to-ROI
analyze, the first-level connectivity-measure matrix is used and the results can be a threshold at the desired
P-value threshold. In this step by graph theoretical analyzing method provides the network measures like
efficiency, centrality, and cost/degree to test the between-subject contrast.
RESULTS
The connectivity contrast values between the PreCG right and the targets show the PreCG has abnormal
communication with thalamus, hippocampus, pPaHC, pSMG and mPFC (P = 0.05). Figure 2 shows ROI-level
results for PreCG left and right PreCG. Effects size for each region is shown by the dot size. We compared
the functional connectivity difference between the left and right PreCG between healthy controls and
schizophrenia patients. Results show that the connectivity of the left Hippocampus with both left and right
PreCG decreased in schizophrenia [Figure 3]. More details about the connectivity impairment of PreCG and
the rest of the brain is demonstrated in the [Tables 2 and 3]. We also compared schizophrenia affects the
PreCG in the male and female patients [Figures 4 and 5].
DISCUSSION
The present study supports the notion of the functional connectivity abnormal connectivity of the precentral
gyrus in schizophrenia [1,2,8-11] . We have shown that PreCG alteration and its abnormal connectivity are not the