
Page 156 - Read Online
P. 156
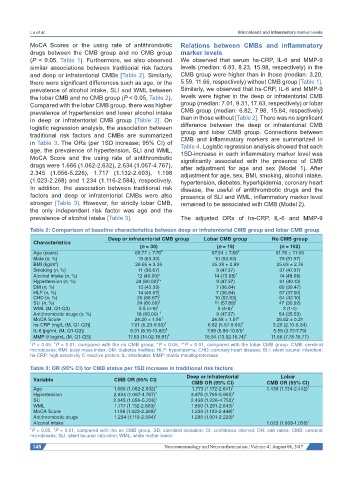
Lu et al.                                                                                                                                                                    Microbleeds and inflammatory marker levels

           MoCA Scores or the using rate of antithrombotic    Relations  between  CMBs  and  inflammatory
           drugs between the CMB group and no CMB group       marker levels
           (P < 0.05, Table 1). Furthermore, we also observed   We observed  that serum hs-CRP, IL-6 and MMP-9
           similar associations between traditional risk factors   levels (median: 6.83, 8.23, 15.98, respectively) in the
           and deep or infratentorial CMBs [Table 2]. Similarly,   CMB group were higher than in those (median: 3.20,
           there were significant differences such as age, or the   5.59, 11.66, respectively) without CMB group [Table 1].
           prevalence of alcohol intake, SLI and WML between   Similarly, we observed that hs-CRP, IL-6 and MMP-9
           the lobar CMB and no CMB group (P < 0.05, Table 2).   levels  were  higher  in the deep  or infratentorial  CMB
           Compared with the lobar CMB group, there was higher   group (median: 7.01, 9.31, 17.63, respectively) or lobar
           prevalence of hypertension and lower alcohol intake   CMB group (median: 6.82, 7.98, 15.84, respectively)
           in deep or infratentorial CMB group  [Table 2]. On   than in those without [Table 2]. There was no significant
           logistic regression analysis, the association between   difference between  the deep or infratentorial  CMB
           traditional  risk  factors  and  CMBs  are  summarized   group and lobar CMB group.  Connections  between
           in Table 3. The ORs (per 1SD increase; 95% CI) of   CMB  and  inflammatory  markers  are  summarized  in
                                                              Table 4. Logistic regression analysis showed that each
           age, the prevalence of hypertension, SLI and WML,   1SD-increase in each inflammatory marker level was
           MoCA Score and the using rate of antithrombotic    significantly  associated  with  the  presence  of  CMB
           drugs were 1.666 (1.062-2.632), 2.634 (1.067-4.767),   after adjustment for age and sex (Model  1).  After
           2.345  (1.056-5.226),  1.717  (1.132-2.603),  1.198   adjustment for age, sex, BMI, smoking, alcohol intake,
           (1.023-2.268) and 1.234 (1.116-2.584), respectively.   hypertension, diabetes, hyperlipidemia, coronary heart
           In addition, the association between traditional risk   disease,  the useful  of antithrombotic  drugs  and  the
           factors and deep or infratentorial CMBs were also   presence of SLI and WML, inflammatory marker level
           stronger  [Table 3]. However, for strictly lobar CMB,   remained to be associated with CMB (Model 2).
           the only independent risk factor was age and the
           prevalence of alcohol intake [Table 3].            The adjusted ORs of hs-CRP, IL-6 and MMP-9

           Table 2: Comparison of baseline characteristics between deep or infratentorial CMB group and lobar CMB group
                                      Deep or infratentorial CMB group  Lobar CMB group      No CMB group
            Characteristics
                                                (n = 30)                  (n = 19)             (n = 152)
            Age (years)                        69.77 ± 7.76 ‡           67.54 ± 7.88 ‡        61.76 ± 11.06
            Male (n, %)                         19 (63.33)               10 (52.63)            79 (51.97)
                    2
            BMI (kg/m )                        26.65 ± 3.35              25.39 ± 2.89         25.63 ± 2.76
            Smoking (n, %)                      11 (36.67)                9 (47.37)            37 (47.37)
            Alcohol intake (n, %)              12 (40.00)*               14 (73.68) †          74 (48.68)
                                                      ‡
            Hypertension (n, %)                24 (80.00) *               9 (47.37)            61 (40.13)
            DM (n, %)                           13 (43.33)                7 (36.84)            60 (39.47)
            HLP (n, %)                          14 (46.67)                7 (36.84)            57 (37.50)
            CHD (n, %)                         20 (66.67) †              10 (52.63)            64 (42.10)
            SLI (n, %)                         24 (80.00) ‡              11 (57.89) †          47 (30.92)
            WML (M, Q1-Q3)                      5.5 (4-6) ‡               5 (4-6) †             2 (1-4)
            Antithrombotic drugs (n, %)        18 (60.00)  †              9 (47.37)            54 (35.53)
            MoCA Score                        24.20 ± 1.56 ‡            24.58 ± 1.07 †        26.62 ± 0.21
            hs-CRP [mg/L (M, Q1-Q3)]         7.01 (5.23-9.93) ‡        6.82 (5.67-9.80) ‡    3.20 (2.10-5.34)
            IL-6 [pg/mL (M, Q1-Q3)]          9.31 (8.15-13.82) ‡       7.98 (5.80-10.81) ‡   5.59 (3.72-7.79)
            MMP-9 [ng/mL (M, Q1-Q3)]        17.63 (14.02-18.91) ‡     15.84 (13.02-16.74) ‡  11.66 (7.78-15.77)
                   ‡
           † P < 0.05,  P < 0.01, compared with the no CMB group; *P < 0.05, **P < 0.01, compared with the lobar CMB group. CMB: cerebral
           microbleeds; BMI: body mass index; DM: diabetes mellitus; HLP: hyperlipemia; CHD: coronary heart disease; SLI: silent lacunar infarction;
           hs-CRP: high-sensitivity C-reactive protein; IL: interleukin; MMP: matrix metalloproteinase
           Table 3: OR (95% CI) for CMB status per 1SD increase in traditional risk factors
                                                                Deep or infratentorial          Lobar
            Variable                    CMB OR (95% CI)
                                                                  CMB OR (95% CI)          CMB OR (95% CI)
            Age                        1.666 (1.062-2.632) †      1.773 (1.172-2.641) †    1.436 (1.134-2.442) †
            Hypertension               2.634 (1.067-4.767) †     3.875 (1.795-5.955) ‡
            SLI                        2.345 (1.056-5.226) †     2.438 (1.226-4.750) ‡
            WML                         1.717 (1.132-2.603) †    1.850 (1.291-2.643) †
            MoCA Score                 1.198 (1.023-2.268) †      1.230 (1.100-2.448) †
            Antithrombotic drugs        1.234 (1.116-2.584) †    1.290 (1.001-2.229) ‡
            Alcohol intake                                                                 1.023 (1.008-1.058) †
                   ‡
           † P < 0.05,  P < 0.01, compared with the no CMB group. SD: standard deviation; CI: confidence interval; OR: odd ratios; CMB: cerebral
           microbleeds; SLI: silent lacunar infarction; WML: white matter lesion
            148                                                                  Neuroimmunology and Neuroinflammation ¦ Volume 4 ¦ August 08, 2017