
Page 31 - Read Online
P. 31
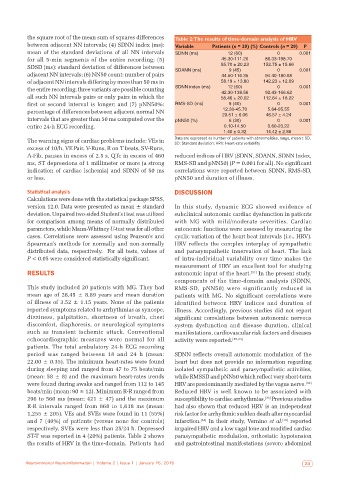
the square root of the mean sum of squares differences   Table 2: The results of time‑domain analysis of HRV
           between adjacent NN intervals; (4) SDNN index (ms):   Variable   Patients (n = 20) (%) Controls (n = 20)  P
           mean of the standard deviations of all NN intervals   SDNN (ms)       12 (60)          0       0.001
           for all 5-min segments of the entire recording;  (5)                45.30‑111.20   86.33‑198.70
           SDSD (ms): standard deviation of differences between   SDANN (ms)   55.70 ± 20.23  152.75 ± 15.66  0.001
                                                                                 9 (45)
                                                                                                  0
           adjacent NN intervals; (6) NN50 count: number of pairs              44.50‑116.35   94.40‑180.68
           of adjacent NN intervals differing by more than 50 ms in            58.19 ± 13.80  142.23 ± 12.09
                                                                                                  0
                                                                                 12 (60)
           the entire recording; three variants are possible counting   SDNN index (ms)  42.30‑138.56  92.43‑166.62  0.001
           all such NN intervals pairs or only pairs in which the              56.46 ± 20.02  112.64 ± 16.22
           first or second interval is longer; and (7) pNN50%:   RMS‑SD (ms)     8 (40)           0       0.001
           percentage of differences between adjacent normal NN                12.30‑45.70     5.64‑95.55
           intervals that are greater than 50 ms computed over the   pNN50 (%)  20.51 ± 6.06  46.57 ± 4.24  0.001
                                                                                                  0
                                                                                 6 (30)
           entire 24-h ECG recording.                                           0.10‑14.50     0.60‑23.22
                                                                               1.40 ± 0.32    14.42 ± 2.86
           The warning signs of cardiac problems include: VEs in   Data are expressed as number of patients with abnormalities, range, mean ± SD.
                                                              SD: Standard deviation; HRV: Heart‑rate variability
           excess of 10/h, VE Pair, V-Runs, R on T beats, SV-Runs,
           A-Fib, pauses in excess of 2.5 s, QTc in excess of 460   reduced indices of HRV (SDNN, SDANN, SDNN Index,
           ms, ST depressions of 1 millimeter or more (a strong   RMS-SD and pNN50) (P = 0.001 for all). No significant
           indication of cardiac ischemia) and SDNN of 50 ms   correlations were reported between SDNN, RMS-SD,
           or less.                                           pNN50 and duration of illness.

           Statistical analysis                               DISCUSSION
           Calculations were done with the statistical package SPSS,
           version 12.0. Data were presented as mean ± standard   In this study, dynamic ECG showed evidence of
           deviation. Unpaired two-sided Student’s t test was utilized   subclinical autonomic cardiac dysfunction in patients
           for comparison among means of normally distributed   with MG with mild/moderate severities. Cardiac
           parameters, while Mann-Whitney U-test was for all other   autonomic functions were assessed by measuring the
           cases. Correlations were assessed using Pearson’s and   cyclic variation of the heart beat intervals (i.e., HRV).
           Spearman’s methods for normally and non-normally   HRV reflects the complex interplay of sympathetic
           distributed data, respectively.  For all tests, values of   and parasympathetic innervation of heart. The lack
           P < 0.05 were considered statistically significant.  of  intra-individual  variability  over  time  makes  the
                                                              measurement of HRV an excellent tool for studying
           RESULTS                                            autonomic input of the heart. [31]  In the present study,
                                                              components of the time-domain analysis  (SDNN,
           This study included 20 patients with MG. They had   RMS-SD,  pNN50)  were  significantly  reduced  in
           mean age of 28.45 ± 8.89 years and mean duration   patients with MG. No significant correlations were
           of illness of 3.52 ± 1.15 years. None of the patients   identified between HRV indices and duration of
           reported symptoms related to arrhythmias as syncope,   illness. Accordingly, previous studies did not report
           dizziness, palpitation, shortness of breath, chest   significant correlations between autonomic nervous
           discomfort, diaphoresis, or neurological symptoms   system dysfunction and disease duration, clinical
           such as transient ischemic attack. Conventional    manifestations, cardiovascular risk factors and diseases
           echocardiographic measures were normal for all     activity were reported. [19,23]
           patients. The total ambulatory 24-h ECG recording
           period was ranged between 18 and 24  h  (mean:     SDNN reflects overall autonomic modulation of the
           22.00 ± 0.35). The minimum heart-rates were found   heart but does not provide no information regarding
           during sleeping and ranged from 47 to 75 beats/min   isolated sympathetic and parasympathetic activities,
           (mean: 58 ± 8) and the maximum heart-rates trends   while RMSSD and pNN50 which reflect very short-term
           were found during awake and ranged from 112 to 145   HRV are predominantly mediated by the vagus nerve. [32]
           beats/min (mean: 90 ± 12). Minimum R-R ranged from   Reduced HRV is well known to be associated with
           296 to 560 ms (mean: 421 ± 47) and the maximum     susceptibility to cardiac arrhythmias.  Previous studies
                                                                                              [33]
           R-R intervals ranged from 868 to 1,618 ms  (mean:   had also shown that reduced HRV is an independent
           1,255 ± 205). VEs and SVEs were found in 11 (55%)   risk factor for arrhythmic sudden death after myocardial
           and 7  (40%)  of patients  (versus none for  controls)   infarction.  In their study, Vernino et al.  reported
                                                                       [34]
                                                                                                    [19]
           respectively. SVEs were less than 25/24 h. Depressed   impaired HRV and a low vagal tone and modified cardiac
           ST-T was reported in 4 (20%) patients. Table 2 shows   parasympathetic modulation, orthostatic hypotension
           the results of HRV in the time-domain.  Patients  had   and gastrointestinal manifestations (severe abdominal


          Neuroimmunol Neuroinflammation | Volume 2 | Issue 1 | January 15, 2015                            23