Page 44 - Read Online
P. 44

Kalloo et al. Metab Target Organ Damage 2023;3:7  https://dx.doi.org/10.20517/mtod.2022.26  Page 5 of 19

                                                                                   significant (win ratio 1.09, 95%CI:
                                                                                   0.97-1.22; P = 0.14)
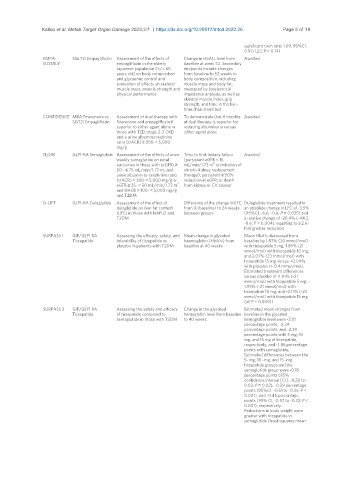
                EMPA-    SGLT2i Empagliflozin  Assessment of the effects of   Change in HbA1c level from   Awaited
                ELDERLY                 empagliflozin in the elderly   baseline at week 52. Secondary
                                        Japanese population (>/= 65   endpoints include changes
                                        years old) on body composition   from baseline to 52 weeks in
                                        and glycaemic control and   body composition, including
                                        evaluation of effects on skeletal   muscle mass and body fat,
                                        muscle mass, muscle strength and  measured by bioelectrical
                                        physical performance   impedance analysis, as well as
                                                               skeletal muscle index, grip
                                                               strength, and time in the five-
                                                               time chair stand test
                CONFIDENCE MRA Finerenone vs   Assessment of dual therapy with   To demonstrate that 6 months  Awaited
                         SGT2i Empagliflozin  finerenone and empagliflozin if   of dual therapy is superior for
                                        superior to either agent alone in   reducing albuminuria versus
                                        those with T2D, stage 2-3 CKD   either agent alone
                                        and a urine albumin:creatinine
                                        ratio (UACR) ≥ 300-< 5,000
                                        mg/g
                FLOW     GLP1-RA Semaglutide Assessment of the effects of once- Time to first: kidney failure   Awaited
                                        weekly semaglutide on renal   (persistent eGFR < 15
                                                                         2
                                        outcomes in those with (eGFR) ≥   mL/min/1.73 m  or initiation of
                                        50 - ≤ 75 mL/min/1.73 m  and  chronic kidney replacement
                                                        2
                                        urine albumin-to-creatinine ratio   therapy); persistent ≥ 50%
                                        (UACR) > 300-< 5,000 mg/g or   reduction in eGFR; or death
                                                             2
                                        eGFR ≥ 25- < 50 mL/min/1.73 m   from kidney or CV causes
                                        and UACR > 100- < 5,000 mg/g
                                        and T2DM
                D-LIFT   GLP1-RA Dulaglutide  Assessment of the effect of   Difference of the change in LFC  Dulaglutide treatment resulted in
                                        dulaglutide on liver fat content   from 0 (baseline) to 24 weeks  an absolute change in LFC of -3.5%
                                        (LFC) in those with NAFLD and   between groups  (95%CI: -6.6, -0.4; P = 0.025) and
                                        T2DM                                       a relative change of -26.4% (-44.2,
                                                                                   -8.6; P = 0.004), equating to a 2.6-
                                                                                   fold greater reduction
                SURPASS 1  GIP/GLP1 RA   Assessing the efficacy, safety, and  Mean change in glycated   Mean HbA1c decreased from
                         Tirzepatide    tolerability of tirzepatide vs   haemoglobin (HbA1c) from   baseline by 1.87% (20 mmol/mol)
                                        placebo in patients with T2DM   baseline at 40 weeks  with tirzepatide 5 mg, 1.89% (21
                                                                                   mmol/mol) with tirzepatide 10 mg,
                                                                                   and 2.07% (23 mmol/mol) with
                                                                                   tirzepatide 15 mg versus +0.04%
                                                                                   with placebo (+ 0.4 mmol/mol),
                                                                                   Estimated treatment differences
                                                                                   versus placebo of -1.91% (-21
                                                                                   mmol/mol) with tirzepatide 5 mg, -
                                                                                   1.93% (-21 mmol/mol) with
                                                                                   tirzepatide 10 mg, and -2.11% (-23
                                                                                   mmol/mol) with tirzepatide 15 mg
                                                                                   (all P < 0.0001)
                SURPASS 2  GIP/GLP1 RA   Assessing the safety and efficacy   Change in the glycated   Estimated mean changes from
                         Tirzepatide    of tirzepatide compared to   hemoglobin level from baseline   baseline in the glycated
                                        semaglutide in those with T2DM  to 40 weeks  hemoglobin level were -2.01
                                                                                   percentage points, -2.24
                                                                                   percentage points, and -2.30
                                                                                   percentage points with 5 mg, 10
                                                                                   mg, and 15 mg of tirzepatide,
                                                                                   respectively, and -1.86 percentage
                                                                                   points with semaglutide;
                                                                                   Estimated differences between the
                                                                                   5- mg, 10 -mg, and 15 -mg
                                                                                   tirzepatide groups and the
                                                                                   semaglutide group were -0.15
                                                                                   percentage points (95%
                                                                                   confidence interval [CI], -0.28 to -
                                                                                   0.03; P = 0.02), -0.39 percentage
                                                                                   points (95%CI: -0.51 to -0.26; P <
                                                                                   0.001), and -0.45 percentage
                                                                                   points (95% CI, -0.57 to -0.32; P <
                                                                                   0.001), respectively.
                                                                                   Reductions in body weight were
                                                                                   greater with tirzepatide vs
                                                                                   semaglutide (least-squares mean
   39   40   41   42   43   44   45   46   47   48   49