
Page 22 - Read Online
P. 22
Page 12 of 22 Ballestri et al. Metab Target Organ Damage 2023;3:1 https://dx.doi.org/10.20517/mtod.2022.23
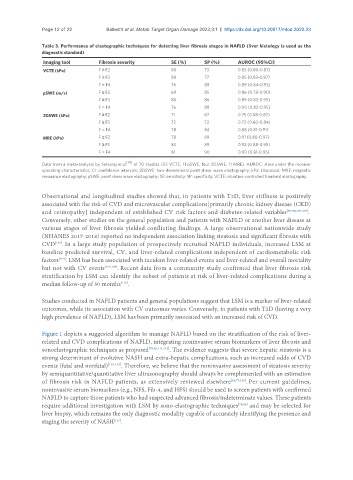
Table 3. Performance of elastographic techniques for detecting liver fibrosis stages in NAFLD (liver histology is used as the
diagnostic standard)
Imaging tool Fibrosis severity SE (%) SP (%) AUROC (95%CI)
VCTE (kPa) F ≥ F2 80 73 0.83 (0.80-0.87)
F ≥ F3 80 77 0.85 (0.83-0.87)
F = F4 76 88 0.89 (0.84-0.93)
pSWE (m/s) F ≥ F2 69 85 0.86 (0.78-0.90)
F ≥ F3 80 86 0.89 (0.83-0.95)
F = F4 76 88 0.90 (0.82-0.95)
2DSWE (kPa) F ≥ F2 71 67 0.75 (0.58-0.87)
F ≥ F3 72 72 0.72 (0.60-0.84)
F = F4 78 84 0.88 (0.81-0.91)
MRE (kPa) F ≥ F2 78 89 0.91 (0.80-0.97)
F ≥ F3 83 89 0.92 (0.88-0.95)
F = F4 81 90 0.90 (0.81-0.95)
[87]
Data from a meta-analysis by Selvaraj et al. of 70 studies (53 VCTE, 11 pSWE, four 2DSWE, 11 MRE). AUROC: Area under the receiver
operating characteristics; CI: confidence intervals; 2DSWE: two-dimensional point shear wave elastography; kPa: kilopascal; MRE: magnetic
resonance elastography; pSWE: point shear wave elastography; SE: sensitivity; SP: specificity; VCTE: vibration-controlled transient elastography.
Observational and longitudinal studies showed that, in patients with T2D, liver stiffness is positively
associated with the risk of CVD and microvascular complications[primarily chronic kidney disease (CKD)
and retinopathy] independent of established CV risk factors and diabetes-related variables [96-98,105-107] .
Conversely, other studies on the general population and patients with NAFLD or another liver disease at
various stages of liver fibrosis yielded conflicting findings. A large observational nationwide study
(NHANES 2017-2018) reported no independent association linking steatosis and significant fibrosis with
CVD . In a large study population of prospectively recruited NAFLD individuals, increased LSM at
[102]
baseline predicted survival, CV, and liver-related complications independent of cardiometabolic risk
factors . LSM has been associated with incident liver-related events and liver-related and overall mortality
[104]
but not with CV events [104,108] . Recent data from a community study confirmed that liver fibrosis risk
stratification by LSM can identify the subset of patients at risk of liver-related complications during a
median follow-up of 50 months .
[110]
Studies conducted in NAFLD patients and general populations suggest that LSM is a marker of liver-related
outcomes, while its association with CV outcomes varies. Conversely, in patients with T2D (having a very
high prevalence of NAFLD), LSM has been primarily associated with an increased risk of CVD.
Figure 1 depicts a suggested algorithm to manage NAFLD based on the stratification of the risk of liver-
related and CVD complications of NAFLD, integrating noninvasive serum biomarkers of liver fibrosis and
sonoelastographic techniques as proposed [78,86,111,112] . The evidence suggests that severe hepatic steatosis is a
strong determinant of evolutive NASH and extra-hepatic complications, such as increased odds of CVD
events (fatal and nonfatal) [113-115] . Therefore, we believe that the noninvasive assessment of steatosis severity
by semiquantitative/quantitative liver ultrasonography should always be complemented with an estimation
of fibrosis risk in NAFLD patients, as extensively reviewed elsewhere [14,77,116] . Per current guidelines,
noninvasive serum biomarkers (e.g., NFS, Fib-4, and HFS) should be used to screen patients with confirmed
NAFLD to capture those patients who had suspected advanced fibrosis/indeterminate values. These patients
require additional investigation with LSM by sono-elastographic techniques [78,86] and may be selected for
liver biopsy, which remains the only diagnostic modality capable of accurately identifying the presence and
staging the severity of NASH .
[117]