
Page 46 - Read Online
P. 46
Abe et al. Mini-invasive Surg 2023;7:28 https://dx.doi.org/10.20517/2574-1225.2023.15 Page 9 of 14
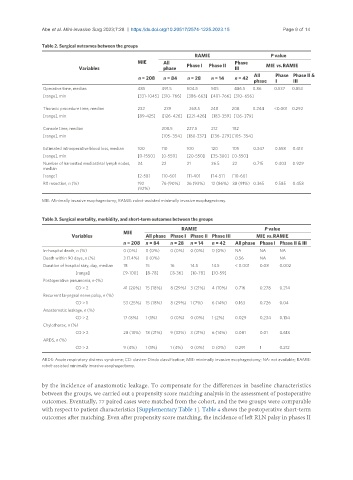
Table 2. Surgical outcomes between the groups
RAMIE P value
MIE All Phase
Variables phase Phase I Phase II III MIE vs. RAMIE
n = 208 n = 84 n = 28 n = 14 n = 42 All Phase Phase II &
phase I III
Operative time, median 485 491.5 504.5 505 486.5 0.86 0.537 0.853
[range], min [331-1045] [310-766] [386-663] [401-766] [310- 656]
Thoracic procedure time, median 232 239 268.5 248 208 0.244 <0.001 0.292
[range], min [89-425] [126-426] [221-426] [183-359] [126- 379]
Console time, median 208.5 227.5 212 182
[range], min [105- 354] [180-337] [136- 279] [105- 354]
Estimated intraoperative blood loss, median 100 110 100 120 105 0.347 0.558 0.413
[range], min [0-1550] [0-550] [20-550] [35-300] [0-550]
Number of harvested mediastinal lymph nodes, 24 22 21 26.5 22 0.715 0.403 0.929
median
[range] [2-58] [10-60] [11-40] [14-51] [10-60]
R0 resection, n (%) 192 76 (90%) 26 (93%) 12 (86%) 38 (91%) 0.365 0.585 0.458
(92%)
MIE: Minimally invasive esophagectomy; RAMIE: robot-assisted minimally invasive esophagectomy.
Table 3. Surgical mortality, morbidity, and short-term outcomes between the groups
RAMIE P value
MIE
Variables All phase Phase I Phase II Phase III MIE vs. RAMIE
n = 208 n = 84 n = 28 n = 14 n = 42 All phase Phase I Phase II & III
In-hospital death, n (%) 0 (0%) 0 (0%) 0 (0%) 0 (0%) 0 (0%) NA NA NA
Death within 90 days, n (%) 3 (1.4%) 0 (0%) 0.56 NA NA
Duration of hospital stay, day, median 18 15 16 14.5 14.5 < 0.001 0.08 0.002
[range] [9-100] [8-78] [8-36] [10-78] [10-59]
Postoperative pneumonia, n (%)
CD > 2 41 (20%) 15 (18%) 8 (29%) 3 (21%) 4 (10%) 0.716 0.278 0.214
Recurrent laryngeal nerve palsy, n (%)
CD > 1 53 (25%) 15 (18%) 8 (29%) 1 (7%) 6 (14%) 0.163 0.726 0.04
Anastomotic leakage, n (%)
CD > 2 17 (8%) 1 (1%) 0 (0%) 0 (0%) 1 (2%) 0.029 0.234 0.134
Chylothorax, n (%)
CD > 2 28 (13%) 18 (21%) 9 (32%) 3 (21%) 6 (14%) 0.081 0.01 0.618
ARDS, n (%)
CD > 2 9 (4%) 1 (1%) 1 (4%) 0 (0%) 0 (0%) 0.291 1 0.212
ARDS: Acute respiratory distress syndrome; CD: clavien-Dindo classification; MIE: minimally invasive esophagectomy; NA: not available; RAMIE:
robot-assisted minimally invasive esophagectomy.
by the incidence of anastomotic leakage. To compensate for the differences in baseline characteristics
between the groups, we carried out a propensity score matching analysis in the assessment of postoperative
outcomes. Eventually, 77 paired cases were matched from the cohort, and the two groups were comparable
with respect to patient characteristics [Supplementary Table 1]. Table 4 shows the postoperative short-term
outcomes after matching. Even after propensity score matching, the incidence of left RLN palsy in phases II