
Page 44 - Read Online
P. 44
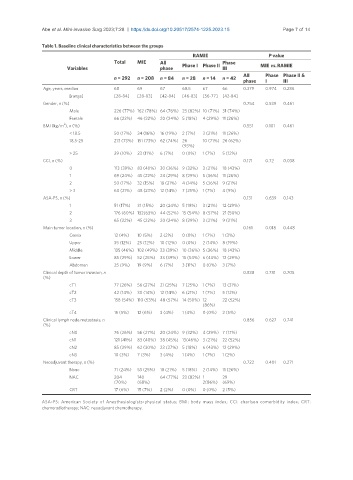
Abe et al. Mini-invasive Surg 2023;7:28  https://dx.doi.org/10.20517/2574-1225.2023.15  Page 7 of 14

               Table 1. Baseline clinical characteristics between the groups
                                                                  RAMIE                     P value
                                       Total   MIE     All                  Phase
                        Variables                      phase  Phase I Phase II  III      MIE vs. RAMIE
                                       n = 292  n = 208  n = 84  n = 28  n = 14  n = 42  All   Phase  Phase II &
                                                                                   phase  I      III
                Age, years, median     68      69      67     68.5   67     66     0.379  0.974  0.286
                        [range]        [28-84]  [28-83]  [42-84]  [46-83]  [56-77]  [42-84]
                Gender, n (%)                                                      0.754  0.539  0.461
                        Male           226 (77%) 162 (78%) 64 (76%) 23 (82%) 10 (71%) 31 (74%)
                        Female         66 (23%)  46 (22%) 20 (24%) 5 (18%)  4 (29%) 11 (26%)
                       2
                BMI (kg/m ), n (%)                                                 0.551  0.101  0.461
                        < 18.5         50 (17%)  34 (16%)  16 (19%)  2 (7%)  3 (21%)  11 (26%)
                        18.5-25        213 (73%) 151 (73%) 62 (74%) 26   10 (71%) 26 (62%)
                                                              (93%)
                        > 25           29 (10%)  23 (11%)  6 (7%)  0 (0%)  1 (7%)  5 (12%)
                CCI, n (%)                                                         0.171  0.72   0.038
                        0              113 (39%) 83 (40%) 30 (36%) 9 (32%)  3 (21%)  18 (43%)
                        1              69 (24%)  45 (22%)  24 (29%) 8 (29%)  5 (36%) 11 (26%)
                        2              50 (17%)  32 (15%)  18 (21%)  4 (14%)  5 (36%) 9 (21%)
                        > 3            60 (21%)  48 (23%) 12 (14%)  7 (25%)  1 (7%)  4 (9%)
                ASA-PS, n (%)                                                      0.131  0.639  0.143
                        1              51 (17%)  31 (15%)  20 (24%) 5 (18%)  3 (21%)  12 (29%)
                        2              176 (60%) 132(63%) 44 (52%) 15 (54%) 8 (57%) 21 (50%)
                        3              65 (22%)  45 (22%)  20 (24%) 8 (29%)  3 (21%)  9 (21%)
                Main tumor location, n (%)                                         0.161  0.018  0.448
                        Cervix         12 (4%)  10 (5%)  2 (2%)  0 (0%)  1 (7%)  1 (3%)
                        Upper          35 (12%)  25 (12%)  10 (12%)  0 (0%)  2 (14%)  8 (19%)
                        Middle         135 (46%) 102 (49%) 33 (39%) 10 (36%) 5 (36%) 18 (43%)
                        Lower          85 (29%)  52 (25%)  33 (39%) 15 (54%) 6 (43%) 12 (29%)
                        Abdomen        25 (9%)  19 (9%)  6 (7%)  3 (11%)  0 (0%)  3 (7%)
                Clinical depth of tumor invasion, n                                0.838  0.781  0.705
                (%)
                        cT1            77 (26%)  56 (27%)  21 (25%)  7 (25%)  1 (7%)  13 (31%)
                        cT2            42 (14%)  30 (14%)  12 (14%)  6 (21%)  1 (7%)  5 (12%)
                        cT3            158 (54%) 110 (53%) 48 (57%) 14 (50%) 12   22 (52%)
                                                                     (86%)
                        cT4            15 (5%)  12 (6%)  3 (4%)  1 (4%)  0 (0%)  2 (5%)
                Clinical lymph node metastasis, n                                  0.856  0.627  0.741
                (%)
                        cN0            76 (26%)  56 (27%)  20 (24%) 9 (32%)  4 (29%) 7 (17%)
                        cN1            121 (41%)  83 (40%) 38 (45%) 13(46%) 3 (21%)  22 (52%)
                        cN2            85 (29%)  62 (30%) 23 (27%) 5 (18%)  6 (43%) 12 (29%)
                        cN3            10 (3%)  7 (3%)  3 (4%)  1 (4%)  1 (7%)  1 (2%)
                Neoadjuvant therapy, n (%)                                         0.722  0.401  0.271
                        None           71 (24%)  53 (25%)  18 (21%)  5 (18%)  2 (14%)  11 (26%)
                        NAC            204     140     64 (77%) 23 (82%) 1   29
                                       (70%)   (68%)                 2(86%)  (69%)
                        CRT            17 (6%)  15 (7%)  2 (2%)  0 (0%)  0 (0%)  2 (5%)
               ASA-PS:  American  Society  of  Anesthesiologists-physical  status;  BMI:  body  mass  index;  CCI:  charlson  comorbidity  index;  CRT:
               chemoradiotherapy; NAC: neoadjuvant chemotherapy.