
Page 74 - Read Online
P. 74
Ghaseminejad et al. J Transl Genet Genom 2022;6:111-25 https://dx.doi.org/10.20517/jtgg.2021.49 Page 119
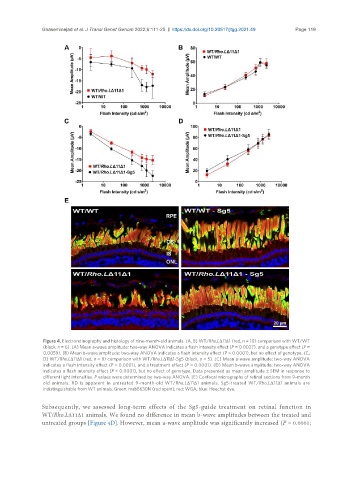
Figure 4. Electroretinography and histology of nine-month-old animals. (A, B) WT/Rho.LΔ11Δ1 (red, n = 10) comparison with WT/WT
(black, n = 6). (A) Mean a-wave amplitude: two-way ANOVA indicates a flash intensity effect (P = 0.0027), and a genotype effect (P =
0.0059). (B) Mean b-wave amplitude: two-way ANOVA indicates a flash intensity effect (P < 0.0001), but no effect of genotype. (C,
D) WT/Rho.LΔ11Δ1 (red, n = 8) comparison with WT/Rho.LΔ11Δ1-Sg5 (black, n = 5). (C) Mean a-wave amplitude: two-way ANOVA
indicates a flash intensity effect (P < 0.0001), and a treatment effect (P = 0.0001). (D) Mean b-wave amplitude: two-way ANOVA
indicates a flash intensity effect (P < 0.0001), but no effect of genotype. Data presented as mean amplitude ± SEM in response to
different light intensities. P values were determined by two-way ANOVA. (E) Confocal micrographs of retinal sections from 9-month
old animals. RD is apparent in untreated 9-month-old WT/Rho.LΔ11Δ1 animals. Sg5-treated WT/Rho.LΔ11Δ1 animals are
indistinguishable from WT animals. Green: mabB630N (rod opsin); red: WGA; blue: Hoechst dye.
Subsequently, we assessed long-term effects of the Sg5-guide treatment on retinal function in
WT/Rho.LΔ11Δ1 animals. We found no difference in mean b-wave amplitudes between the treated and
untreated groups [Figure 4D]. However, mean a-wave amplitude was significantly increased (P = 0.0001;