
Page 73 - Read Online
P. 73
Page 118 Ghaseminejad et al. J Transl Genet Genom 2022;6:111-25 https://dx.doi.org/10.20517/jtgg.2021.49
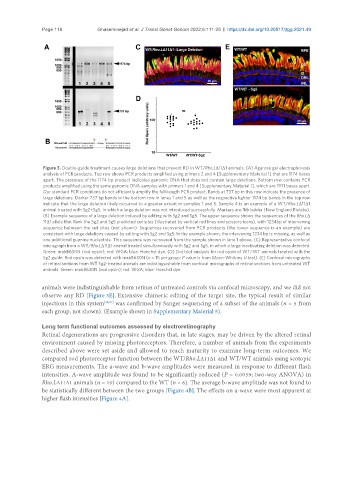
Figure 3. Double-guide treatment causes large deletions that prevent RD in WT/Rho.LΔ11Δ1 animals. (A) Agarose gel electrophoresis
analysis of PCR products. Top row shows PCR products amplified using primers 2 and 4 [Supplementary Material 1] that are 1174 bases
apart. The presence of the 1174 bp product indicates genomic DNA that does not contain large deletions. Bottom row contains PCR
products amplified using the same genomic DNA samples with primers 1 and 4 [Supplementary Material 1], which are 1971 bases apart.
Our standard PCR conditions do not efficiently amplify the full-length PCR product. Bands at 737 bp in this row indicate the presence of
large deletions. Darker 737 bp bands in the bottom row in lanes 1 and 5 as well as the respective lighter 1174 bp bands in the top row
indicate that the large deletion likely occurred to a greater extent in samples 1 and 5. Sample 4 is an example of a WT/Rho.LΔ11Δ1
animal treated with Sg2+Sg5, in which a large deletion was not introduced successfully. Markers are 1kb ladder (New England Biolabs).
(B) Example sequence of a large deletion induced by editing with Sg2 and Sg5. The upper sequence shows the sequences of the Rho.LΔ
11Δ1 allele that flank the Sg2 and Sg5 predicted cut sites (illustrated by vertical red lines and scissors icons), with 1234bp of intervening
sequence between the cut sites (not shown). Sequences recovered from PCR products (the lower sequence is an example) are
consistent with large deletions caused by editing with Sg2 and Sg5. In the example shown, the intervening 1234 bp is missing, as well as
one additional guanine nucleotide. This sequence was recovered from the sample shown in lane 1 above. (C) Representative confocal
micrograph from a WT/Rho.LΔ11Δ1 animal treated simultaneously with Sg2 and Sg5, in which a large inactivating deletion was detected.
Green: mabB630N (rod opsin); red: WGA; blue: Hoechst dye. (D) Dot blot analysis for rod opsin of WT/WT animals treated with the
Sg2 guide. Rod opsin was detected with mabB630N (n = 15 per group; P value is from Mann-Whitney U test). (E) Confocal micrographs
of retinal sections from WT Sg2-treated animals are indistinguishable from confocal micrographs of retinal sections from untreated WT
animals. Green: mabB630N (rod opsin); red: WGA; blue: Hoechst dye.
animals were indistinguishable from retinas of untreated controls via confocal microscopy, and we did not
observe any RD [Figure 3E]. Extensive chimeric editing of the target site, the typical result of similar
injections in this system [12,27] was confirmed by Sanger sequencing of a subset of the animals (n = 5 from
each group, not shown). (Example shown in Supplementary Material 5).
Long term functional outcomes assessed by electroretinography
Retinal degenerations are progressive disorders that, in late stages, may be driven by the altered retinal
environment caused by missing photoreceptors. Therefore, a number of animals from the experiments
described above were set aside and allowed to reach maturity to examine long-term outcomes. We
compared rod photoreceptor function between the WT/Rho.LΔ11Δ1 and WT/WT animals using scotopic
ERG measurements. The a-wave and b-wave amplitudes were measured in response to different flash
intensities. A-wave amplitude was found to be significantly reduced (P = 0.0059; two-way ANOVA) in
Rho.LΔ11Δ1 animals (n = 10) compared to the WT (n = 6). The average b-wave amplitude was not found to
be statistically different between the two groups [Figure 4B]. The effects on a-wave were most apparent at
higher flash intensities [Figure 4A].