
Page 42 - Read Online
P. 42
Page 55 Plössl et al. J Transl Genet Genom 2022;6:46-62 https://dx.doi.org/10.20517/jtgg.2021.39
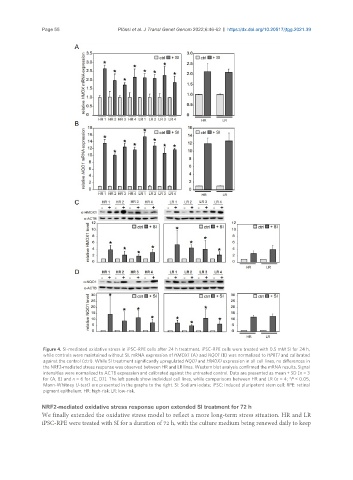
Figure 4. SI-mediated oxidative stress in iPSC-RPE cells after 24 h treatment. iPSC-RPE cells were treated with 0.5 mM SI for 24 h,
while controls were maintained without SI. mRNA expression of HMOX1 (A) and NQO1 (B) was normalized to HPRT1 and calibrated
against the control (ctrl). While SI treatment significantly upregulated NQO1 and HMOX1 expression in all cell lines, no differences in
the NRF2-mediated stress response was observed between HR and LR lines. Western blot analysis confirmed the mRNA results. Signal
intensities were normalized to ACTB expression and calibrated against the untreated control. Data are presented as mean + SD [n = 3
for (A, B) and n = 6 for (C, D)]. The left panels show individual cell lines, while comparisons between HR and LR (n = 4; *P < 0.05,
Mann-Whitney U-test) are presented in the graphs to the right. SI: Sodium iodate; iPSC: induced pluripotent stem cell; RPE: retinal
pigment epithelium; HR: high-risk; LR: low-risk.
NRF2-mediated oxidative stress response upon extended SI treatment for 72 h
We finally extended the oxidative stress model to reflect a more long-term stress situation. HR and LR
iPSC-RPE were treated with SI for a duration of 72 h, with the culture medium being renewed daily to keep