
Page 40 - Read Online
P. 40
Page 53 Plössl et al. J Transl Genet Genom 2022;6:46-62 https://dx.doi.org/10.20517/jtgg.2021.39
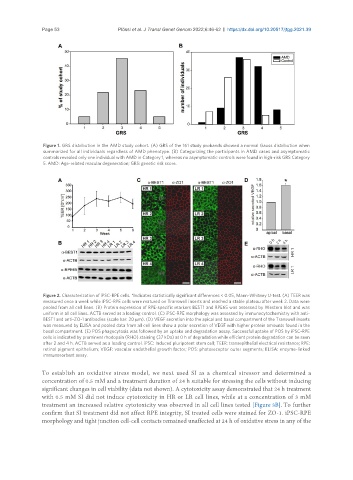
Figure 1. GRS distribution in the AMD study cohort. (A) GRS of the 161 study probands showed a normal Gauss distribution when
summarized for all individuals regardless of AMD phenotype. (B) Categorizing the participants in AMD cases and asymptomatic
controls revealed only one individual with AMD in Category 1, whereas no asymptomatic controls were found in high-risk GRS Category
5. AMD: Age-related macular degeneration; GRS: genetic risk score.
Figure 2. Characterization of iPSC-RPE cells. *Indicates statistically significant differences < 0.05, Mann-Whitney U-test. (A) TEER was
measured once a week while iPSC-RPE cells were matured on Transwell inserts and reached a stable plateau after week 2. Data were
pooled from all cell lines. (B) Protein expression of RPE-specific markers BEST1 and RPE65 was assessed by Western blot and was
uniform in all cell lines. ACTB served as a loading control. (C) iPSC-RPE morphology was assessed by immunocytochemistry with anti-
BEST1 and anti-ZO-1 antibodies (scale bar: 20 µm). (D) VEGF secretion into the apical and basal compartment of the Transwell inserts
was measured by ELISA and pooled data from all cell lines show a polar secretion of VEGF with higher protein amounts found in the
basal compartment. (E) POS phagocytosis was followed by an uptake and degradation assay. Successful uptake of POS by iPSC-RPE
cells is indicated by prominent rhodopsin (RHO) staining (37 kDa) at 0 h of degradation while efficient protein degradation can be seen
after 2 and 4 h. ACTB served as a loading control. iPSC: Induced pluripotent stem cell; TEER: transepithelial electrical resistance; RPE:
retinal pigment epithelium; VEGF: vascular endothelial growth factor; POS: photoreceptor outer segments; ELISA: enzyme-linked
immunosorbent assay.
To establish an oxidative stress model, we next used SI as a chemical stressor and determined a
concentration of 0.5 mM and a treatment duration of 24 h suitable for stressing the cells without inducing
significant changes in cell viability (data not shown). A cytotoxicity assay demonstrated that 24 h treatment
with 0.5 mM SI did not induce cytotoxicity in HR or LR cell lines, while at a concentration of 3 mM
treatment an increased relative cytotoxicity was observed in all cell lines tested [Figure 3B]. To further
confirm that SI treatment did not affect RPE integrity, SI treated cells were stained for ZO-1. iPSC-RPE
morphology and tight junction cell-cell contacts remained unaffected at 24 h of oxidative stress in any of the