
Page 41 - Read Online
P. 41
Plössl et al. J Transl Genet Genom 2022;6:46-62 https://dx.doi.org/10.20517/jtgg.2021.39 Page 54
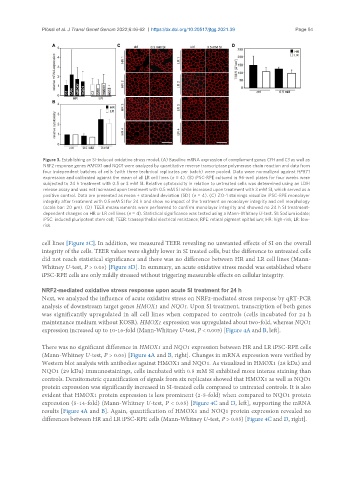
Figure 3. Establishing an SI-induced oxidative stress model. (A) Baseline mRNA expression of complement genes CFH and C3 as well as
NRF2 response genes HMOX1 and NQO1 were analyzed by quantitative reverse transcriptase polymerase chain reaction and data from
four independent batches of cells (with three technical replicates per batch) were pooled. Data were normalized against HPRT1
expression and calibrated against the mean of all LR cell lines (n = 4). (B) iPSC-RPE cultured in 96-well plates for four weeks were
subjected to 24 h treatment with 0.5 or 3 mM SI. Relative cytotoxicity in relation to untreated cells was determined using an LDH
release assay and was not increased upon treatment with 0.5 mM SI while increased upon treatment with 3 mM SI, which served as a
positive control. Data are presented as mean + standard deviation (SD) (n = 4). (C) ZO-1 stainings visualize iPSC-RPE monolayer
integrity after treatment with 0.5 mM SI for 24 h and show no impact of the treatment on monolayer integrity and cell morphology
(scale bar: 20 µm). (D) TEER measurements were performed to confirm monolayer integrity and showed no 24 h SI treatment-
dependent changes on HR or LR cell lines (n = 4). Statistical significance was tested using a Mann-Whitney U-test. SI: Sodium iodate;
iPSC: induced pluripotent stem cell; TEER: transepithelial electrical resistance; RPE: retinal pigment epithelium; HR: high-risk; LR: low-
risk.
cell lines [Figure 3C]. In addition, we measured TEER revealing no unwanted effects of SI on the overall
integrity of the cells. TEER values were slightly lower in SI treated cells, but the difference to untreated cells
did not reach statistical significance and there was no difference between HR and LR cell lines (Mann-
Whitney U-test, P > 0.05) [Figure 3D]. In summary, an acute oxidative stress model was established where
iPSC-RPE cells are only mildly stressed without triggering measurable effects on cellular integrity.
NRF2-mediated oxidative stress response upon acute SI treatment for 24 h
Next, we analyzed the influence of acute oxidative stress on NRF2-mediated stress response by qRT-PCR
analysis of downstream target genes HMOX1 and NQO1. Upon SI treatment, transcription of both genes
was significantly upregulated in all cell lines when compared to controls (cells incubated for 24 h
maintenance medium without KOSR). HMOX1 expression was upregulated about two-fold, whereas NQO1
expression increased up to 10-16-fold (Mann-Whitney U-test, P < 0.005) [Figure 4A and B, left].
There was no significant difference in HMOX1 and NQO1 expression between HR and LR iPSC-RPE cells
(Mann-Whitney U-test, P > 0.05) [Figure 4A and B, right]. Changes in mRNA expression were verified by
Western blot analysis with antibodies against HMOX1 and NQO1. As visualized in HMOX1 (28 kDa) and
NQO1 (29 kDa) immunostainings, cells incubated with 0.5 mM SI exhibited more intense staining than
controls. Densitometric quantification of signals from six replicates showed that HMOX1 as well as NQO1
protein expression was significantly increased in SI-treated cells compared to untreated controls. It is also
evident that HMOX1 protein expression is less prominent (2-5-fold) when compared to NQO1 protein
expression (5-14-fold) (Mann-Whitney U-test, P < 0.05) [Figure 4C and D, left], supporting the mRNA
results [Figure 4A and B]. Again, quantification of HMOX1 and NOQ1 protein expression revealed no
differences between HR and LR iPSC-RPE cells (Mann-Whitney U-test, P > 0.05) [Figure 4C and D, right].