
Page 39 - Read Online
P. 39
Plössl et al. J Transl Genet Genom 2022;6:46-62 https://dx.doi.org/10.20517/jtgg.2021.39 Page 52
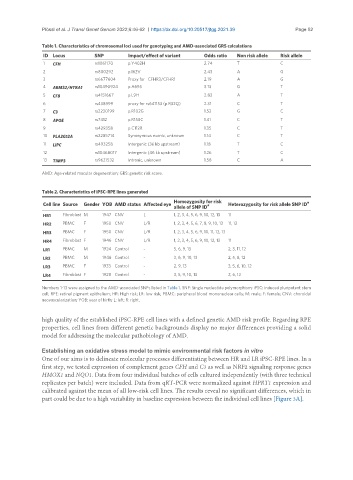
Table 1. Characteristics of chromosomal loci used for genotyping and AMD-associated GRS calculations
ID Locus SNP Impact/effect of variant Odds ratio Non risk allele Risk allele
1 CFH rs1061170 p.Y402H 2.74 T C
2 rs800292 p.I62V 2.43 A G
3 rs6677604 Proxy for CFHR3/CFHR1 2.19 A G
4 ARMS2/HTRA1 rs10490924 p.A69S 3.13 G T
5 CFB rs4151667 p.L9H 2.82 A T
6 rs438999 proxy for rs641153 (p.R32Q) 2.31 C T
7 C3 rs2230199 p.R102G 1.52 G C
8 APOE rs7412 p.R158C 1.41 C T
9 rs429358 p.C112R 1.35 C T
10 PLA2G12A rs2285714 Synonymous exonic, unknown 1.14 C T
11 LIPC rs493258 Intergenic (36 kb upstream) 1.18 T C
12 rs10468017 Intergenic (46 kb upstream) 1.26 T C
13 TIMP3 rs9621532 Intronic, unknown 1.58 C A
AMD: Age-related macular degeneration; GRS: genetic risk score.
Table 2. Characteristics of iPSC-RPE lines generated
Homozygosity for risk #
Cell line Source Gender YOB AMD status Affected eye allele of SNP ID # Heterozygosity for risk allele SNP ID
HR1 Fibroblast M 1947 CNV L 1, 2, 3, 4, 5, 6, 9, 10, 12, 13 11
HR2 PBMC F 1950 CNV L/R 1, 2, 3, 4, 5, 6, 7, 8, 9, 10, 13 11, 12
HR3 PBMC F 1950 CNV L/R 1, 2, 3, 4, 5, 6, 9, 10, 11, 12, 13
HR4 Fibroblast F 1946 CNV L/R 1, 2, 3, 4, 5, 6, 9, 10, 12, 13 11
LR1 PBMC M 1924 Control - 5, 6, 9, 13 2, 3, 11, 12
LR2 PBMC M 1946 Control - 3, 6, 9, 10, 13 2, 5, 8, 12
LR3 PBMC F 1933 Control - 2, 9, 13 3, 5, 6, 10, 12
LR4 Fibroblast F 1928 Control - 3, 5, 9, 10, 13 2, 6, 12
Numbers 1-13 were assigned to the AMD-associated SNPs listed in Table 1. SNP: Single nucleotide polymorphism; iPSC: induced pluripotent stem
cell; RPE: retinal pigment epithelium; HR: High risk; LR: low risk; PBMC: peripheral blood mononuclear cells; M: male; F: female; CNV: choroidal
neovascularization; YOB: year of birth; L: left; R: right.
high quality of the established iPSC-RPE cell lines with a defined genetic AMD risk profile. Regarding RPE
properties, cell lines from different genetic backgrounds display no major differences providing a solid
model for addressing the molecular pathobiology of AMD.
Establishing an oxidative stress model to mimic environmental risk factors in vitro
One of our aims is to delineate molecular processes differentiating between HR and LR iPSC-RPE lines. In a
first step, we tested expression of complement genes CFH and C3 as well as NRF2 signaling response genes
HMOX1 and NQO1. Data from four individual batches of cells cultured independently (with three technical
replicates per batch) were included. Data from qRT-PCR were normalized against HPRT1 expression and
calibrated against the mean of all low-risk cell lines. The results reveal no significant differences, which in
part could be due to a high variability in baseline expression between the individual cell lines [Figure 3A].