
Page 11 - Read Online
P. 11
Page 255 Saleh et al. J Transl Genet Genom 2021;5:250-64 https://dx.doi.org/10.20517/jtgg.2021.23
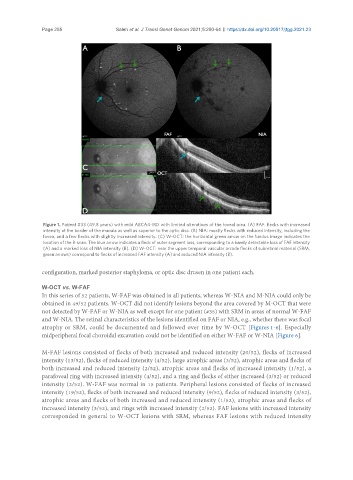
Figure 1. Patient #33 (49.8 years) with mild ABCA4-IRD with limited alterations of the foveal area. (A) FAF: flecks with increased
intensity at the border of the macula as well as superior to the optic disc. (B) NIA: mostly flecks with reduced intensity, including the
fovea, and a few flecks with slightly increased intensity. (C) W-OCT: the horizontal green arrow on the fundus image indicates the
location of the B-scan. The blue arrow indicates a fleck of outer segment loss, corresponding to a barely detectable loss of FAF intensity
(A) and a marked loss of NIA intensity (B). (D) W-OCT: near the upper temporal vascular arcade flecks of subretinal material (SRM,
green arrows) correspond to flecks of increased FAF intensity (A) and reduced NIA intensity (B).
configuration, marked posterior staphyloma, or optic disc drusen in one patient each.
W-OCT vs. W-FAF
In this series of 52 patients, W-FAF was obtained in all patients, whereas W-NIA and M-NIA could only be
obtained in 49/52 patients. W-OCT did not identify lesions beyond the area covered by M-OCT that were
not detected by W-FAF or W-NIA as well except for one patient (#35) with SRM in areas of normal W-FAF
and W-NIA. The retinal characteristics of the lesions identified on FAF or NIA, e.g., whether there was focal
atrophy or SRM, could be documented and followed over time by W-OCT [Figures 1-6]. Especially
midperipheral focal choroidal excavation could not be identified on either W-FAF or W-NIA [Figure 6].
M-FAF lesions consisted of flecks of both increased and reduced intensity (20/52), flecks of increased
intensity (13/52), flecks of reduced intensity (4/52), large atrophic areas (3/52), atrophic areas and flecks of
both increased and reduced intensity (2/52), atrophic areas and flecks of increased intensity (1/52), a
parafoveal ring with increased intensity (4/52), and a ring and flecks of either increased (3/52) or reduced
intensity (2/52). W-FAF was normal in 15 patients. Peripheral lesions consisted of flecks of increased
intensity (19/52), flecks of both increased and reduced intensity (9/52), flecks of reduced intensity (3/52),
atrophic areas and flecks of both increased and reduced intensity (1/52), atrophic areas and flecks of
increased intensity (3/52), and rings with increased intensity (2/52). FAF lesions with increased intensity
corresponded in general to W-OCT lesions with SRM, whereas FAF lesions with reduced intensity