
Page 93 - Read Online
P. 93
Page 223 Xu et al. J Transl Genet Genom 2021;5:218-39 https://dx.doi.org/10.20517/jtgg.2021.20
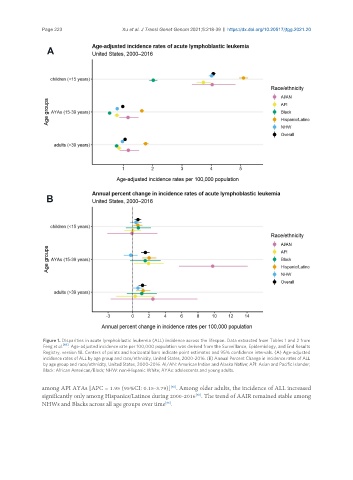
Figure 1. Disparities in acute lymphoblastic leukemia (ALL) incidence across the lifespan. Data extracted from Tables 1 and 2 from
Feng et al. [66] . Age-adjusted incidence rate per 100,000 population was derived from the Surveillance, Epidemiology, and End Results
Registry, version 18. Centers of points and horizontal bars indicate point estimates and 95% confidence intervals. (A) Age-adjusted
incidence rates of ALL by age group and race/ethnicity, United States, 2000-2016. (B) Annual Percent Change in incidence rates of ALL
by age group and race/ethnicity, United States, 2000-2016. AI/AN: American Indian and Alaska Native; API: Asian and Pacific Islander;
Black: African American/Black; NHW: non-Hispanic White; AYAs: adolescents and young adults.
among API AYAs [APC = 1.95 (95%CI: 0.15-3.79)] . Among older adults, the incidence of ALL increased
[66]
significantly only among Hispanics/Latinos during 2000-2016 . The trend of AAIR remained stable among
[66]
NHWs and Blacks across all age groups over time .
[66]