
Page 91 - Read Online
P. 91
Page 221 Xu et al. J Transl Genet Genom 2021;5:218-39 https://dx.doi.org/10.20517/jtgg.2021.20
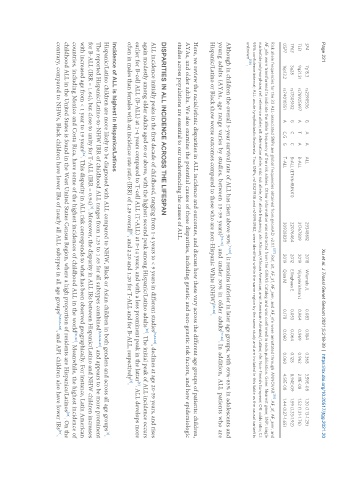
SP4 7p15.3 rs2390536 G A A ALL 29348612 2018 Wiemels JL 0.083 0.184 0.368 3.59E-08 1.20 (1.13-1.29)
TLE1 9q21.31 rs76925697 A T A B-ALL 31767839 2019 Vijayakrishnan J 0.964 0.969 0.962 2.11E-08 1.52 (1.31-1.76)
TP63 3q28 rs17505102 G C C B-ALL (ETV6-RUNX1) 22076464 2012 Ellinghaus E 0.053 0.064 0.128 8.94E-09 1.59 (1.33-1.92)
USP7 16p13.2 rs74010351 A C,G G T-ALL 30938820 2019 Qian M 0.178 0.060 0.060 4.51E-08 1.44 (1.27-1.65)
Risk allele frequencies for the 33 ALL-associated SNPs are global frequencies obtained from gnomAD v2.1.1. [57] . Ref, alt, AF_af, AF_amr, and AF_nfe were annotated through ANNOVAR [58] . AF_af, AF_amr, and
AF_nfe were transformed to indicate the allele frequency of the risk alleles. Other information was extracted from the GWAS Catalog and was confirmed in each publication. Gene: Nearest gene; SNP: single
nucleotide polymorphism; ref: reference allele; alt: alternative allele; risk: risk allele; AF: allele frequency; afr: African/African American; amr: American Admixed/Latino; nfe: Non-Finnish European; OR: odds ratio; CI:
95% confidence interval; ALL: acute lymphoblastic leukemia. Two SNPs, rs10821936 and rs10994982, were identified within the same region by the same study and are included in this table as the causal variant is
unknown [59] .
Although in children the overall 5-year survival rate of ALL has risen above 90% [71,72] , it remains inferior in later age groups, with 60%-85% in adolescents and
young adults (AYAs, age range varies by studies, between 15-39 years) [73-76] , and under 30% in older adults [77-82] . In addition, ALL patients who are
Hispanic/Latino or Black show worse outcomes compared to those who are non-Hispanic White (NHW) [83-89] .
Here, we review the racial/ethnic disparities in ALL incidence and outcomes, and discuss how these vary across the different age groups of patients: children,
AYAs, and older adults. We also examine the potential causes of these disparities, including genetic and non-genetic risk factors, and how epidemiologic
studies across populations are essential to our understanding the causes of ALL.
DISPARITIES IN ALL INCIDENCE ACROSS THE LIFESPAN
ALL incidence initially peaks in the first decade of childhood, ranging from 1-4 years to < 9 years in different studies [5,64-66] , declines at age 20-59 years, and rises
[90]
again modestly among older adults aged 60 or above, with the highest second peak among Hispanic/Latino adults . The initial peak of ALL incidence occurs
earlier for B-cell ALL (B-ALL) at 1-4 years compared to T-cell ALL (T-ALL) at 5-14 years, and with a less prominent peak in the latter . ALL develops more
[5]
often in males than females with an incidence rate ratio (IRR) of 1.29 overall , and 2.20 and 1.20 for T-ALL and for B-ALL, respectively .
[5]
[3]
Incidence of ALL is highest in Hispanics/Latinos
[5]
Hispanic/Latino children are more likely to be diagnosed with ALL compared to NHW, Black or Asian children in both genders and across all age groups .
The reported Hispanic/Latino-to-NHW IRR of childhood ALL ranges from 1.25 to 1.65 for all subtypes combined [5,62,64-66] , and appears to be more prominent
[5]
for B-ALL (IRR = 1.64), but close to unity for T-ALL (IRR = 0.94) . Moreover, the disparity in ALL IRs between Hispanic/Latino and NHW children increases
with increased age from < 1 year to 19 years . This disparity in ALL risk corresponds to what has been observed geographically. For instance, Latin American
[64]
countries, including Mexico and Costa Rica, have some of the highest incidences of childhood ALL in the world [91,92] . Meanwhile, the highest incidence of
[65]
childhood ALL in the United States is found in the West United States Census Region, where a high proportion of residents are Hispanics/Latinos . On the
contrary, compared to NHWs, Black children have lower IRs of nearly all ALL subtypes in all age groups [5,62,64-66] , and API children also have lower IRs .
[93]