
Page 98 - Read Online
P. 98
Xu et al. J Transl Genet Genom 2021;5:218-39 https://dx.doi.org/10.20517/jtgg.2021.20 Page 228
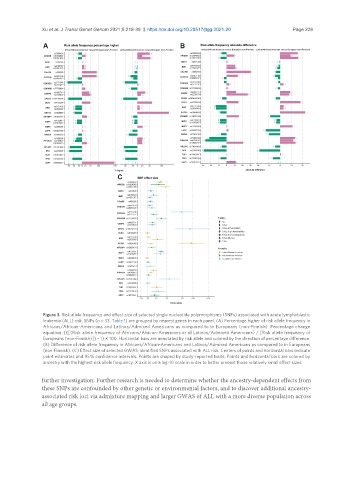
Figure 3. Risk allele frequency and effect size of selected single nucleotide polymorphisms (SNPs) associated with acute lymphoblastic
leukemia (ALL) risk. SNPs (n = 33, Table 1) are grouped by nearest genes in each panel. (A) Percentage higher of risk allele frequency in
Africans/African-Americans and Latinos/Admixed Americans as compared to in Europeans (non-Finnish). Percentage change
equation: {{[(Risk allele frequency of Africans/African-Americans or of Latinos/Admixed Americans) / [Risk allele frequency of
Europeans (non-Finnish)]} - 1} × 100. Horizontal bars are annotated by risk allele and colored by the direction of percentage difference.
(B) Difference of risk allele frequency in Africans/African-Americans and Latinos/Admixed Americans as compared to in Europeans
(non-Finnish). (C) Effect size of selected GWAS-identified SNPs associated with ALL risk. Centers of points and horizontal bars indicate
point estimates and 95% confidence intervals. Points are shaped by study-reported traits. Points and horizontal bars are colored by
ancestry with the highest risk allele frequency. X axis is on a log-10 scale in order to better present those relatively small effect sizes.
further investigation. Further research is needed to determine whether the ancestry-dependent effects from
these SNPs are confounded by other genetic or environmental factors, and to discover additional ancestry-
associated risk loci via admixture mapping and larger GWAS of ALL with a more diverse population across
all age groups.