
Page 97 - Read Online
P. 97
Page 227 Xu et al. J Transl Genet Genom 2021;5:218-39 https://dx.doi.org/10.20517/jtgg.2021.20
[140]
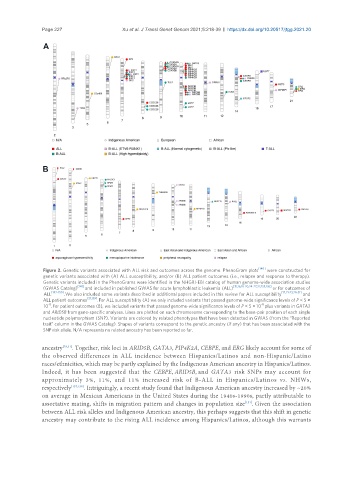
Figure 2. Genetic variants associated with ALL risk and outcomes across the genome. PhenoGram plots were constructed for
genetic variants associated with (A) ALL susceptibility, and/or (B) ALL patient outcomes (i.e., relapse and response to therapy).
Genetic variants included in the PhenoGrams were identified in the NHGRI-EBI catalog of human genome-wide association studies
(GWAS Catalog) [141] and included in published GWAS for acute lymphoblastic leukemia (ALL) [15,16,18-20,24-27,32,135,136] or for outcomes of
ALL [142-150] . We also included some variants described in additional papers included in this review for ALL susceptibility [17,21-23,28-31] and
ALL patient outcomes [21,139] . For ALL susceptibility (A) we only included variants that passed genome-wide significance levels of P < 5 ×
-8
-8
10 . For patient outcomes (B), we included variants that passed genome-wide significance levels of P < 5 × 10 plus variants in GATA3
and ARID5B from gene-specific analyses. Lines are plotted on each chromosome corresponding to the base-pair position of each single
nucleotide polymorphism (SNP). Variants are colored by related phenotypes that have been detected in GWAS (from the “Reported
trait” column in the GWAS Catalog). Shapes of variants correspond to the genetic ancestry (if any) that has been associated with the
SNP risk allele. N/A represents no related ancestry has been reported so far.
ancestry [29,31] . Together, risk loci in ARID5B, GATA3, PIP4K2A, CEBPE, and ERG likely account for some of
the observed differences in ALL incidence between Hispanics/Latinos and non-Hispanic/Latino
races/ethnicities, which may be partly explained by the Indigenous American ancestry in Hispanics/Latinos.
Indeed, it has been suggested that the CEBPE, ARID5B, and GATA3 risk SNPs may account for
approximately 3%, 11%, and 11% increased risk of B-ALL in Hispanics/Latinos vs. NHWs,
respectively [137,138] . Intriguingly, a recent study found that Indigenous American ancestry increased by ~20%
on average in Mexican Americans in the United States during the 1940s-1990s, partly attributable to
assortative mating, shifts in migration pattern and changes in population size . Given the association
[151]
between ALL risk alleles and Indigenous American ancestry, this perhaps suggests that this shift in genetic
ancestry may contribute to the rising ALL incidence among Hispanics/Latinos, although this warrants